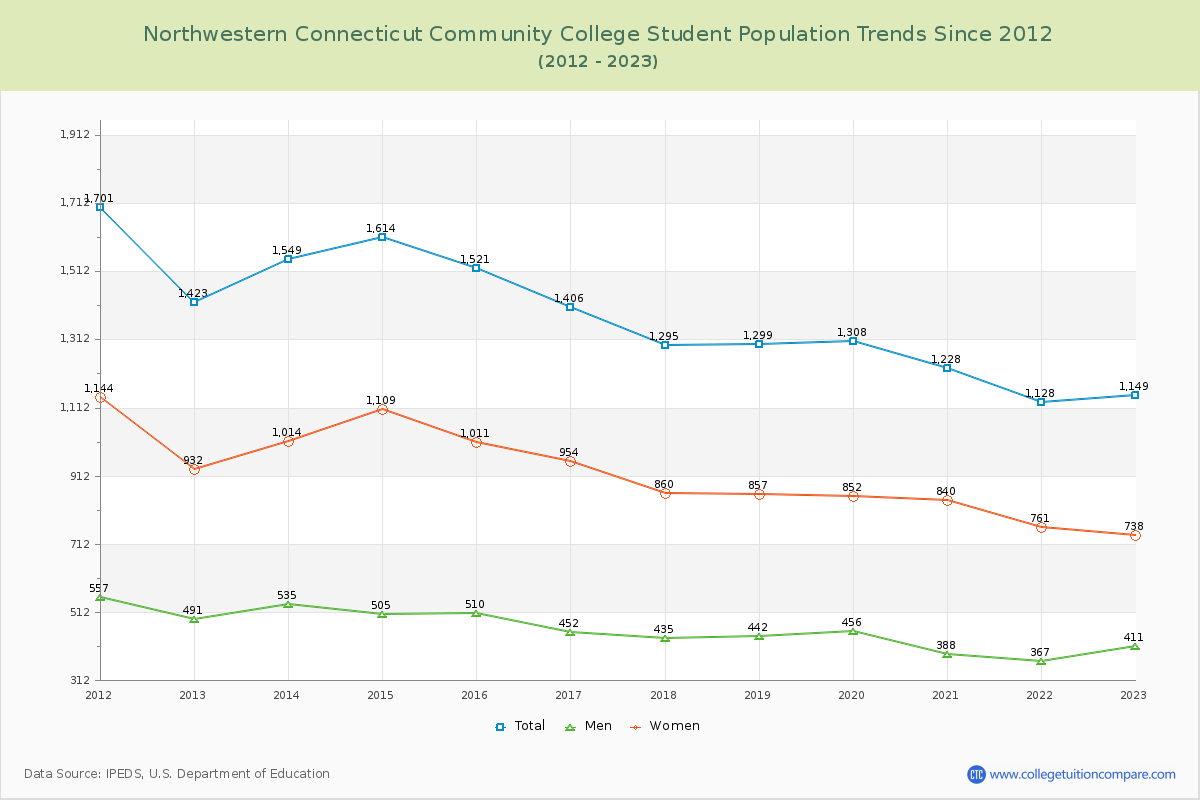
Student Population Changes
The average student population over the last 12 years is 1,356 where 1,149 students are attending the school for the academic year 2022-2023.
The female to male ratio is 1.80 to 1 and it means that there are more female students enrolled in NWCC than male students.
The following table and chart illustrate the changes in student population by gender at Northwestern Connecticut Community College since 2012.
| Year | Total | Men | Women |
|---|---|---|---|
| 2012-13 | 1,423 | 491 | 932 |
| 2013-14 | 1,549 126 | 535 44 | 1,014 82 |
| 2014-15 | 1,614 65 | 505 -30 | 1,109 95 |
| 2015-16 | 1,521 -93 | 510 5 | 1,011 -98 |
| 2016-17 | 1,406 -115 | 452 -58 | 954 -57 |
| 2017-18 | 1,295 -111 | 435 -17 | 860 -94 |
| 2018-19 | 1,299 4 | 442 7 | 857 -3 |
| 2019-20 | 1,308 9 | 456 14 | 852 -5 |
| 2020-21 | 1,228 -80 | 388 -68 | 840 -12 |
| 2021-22 | 1,128 -100 | 367 -21 | 761 -79 |
| 2022-23 | 1,149 21 | 411 44 | 738 -23 |
| Average | 1,356 | 454 | 903 |