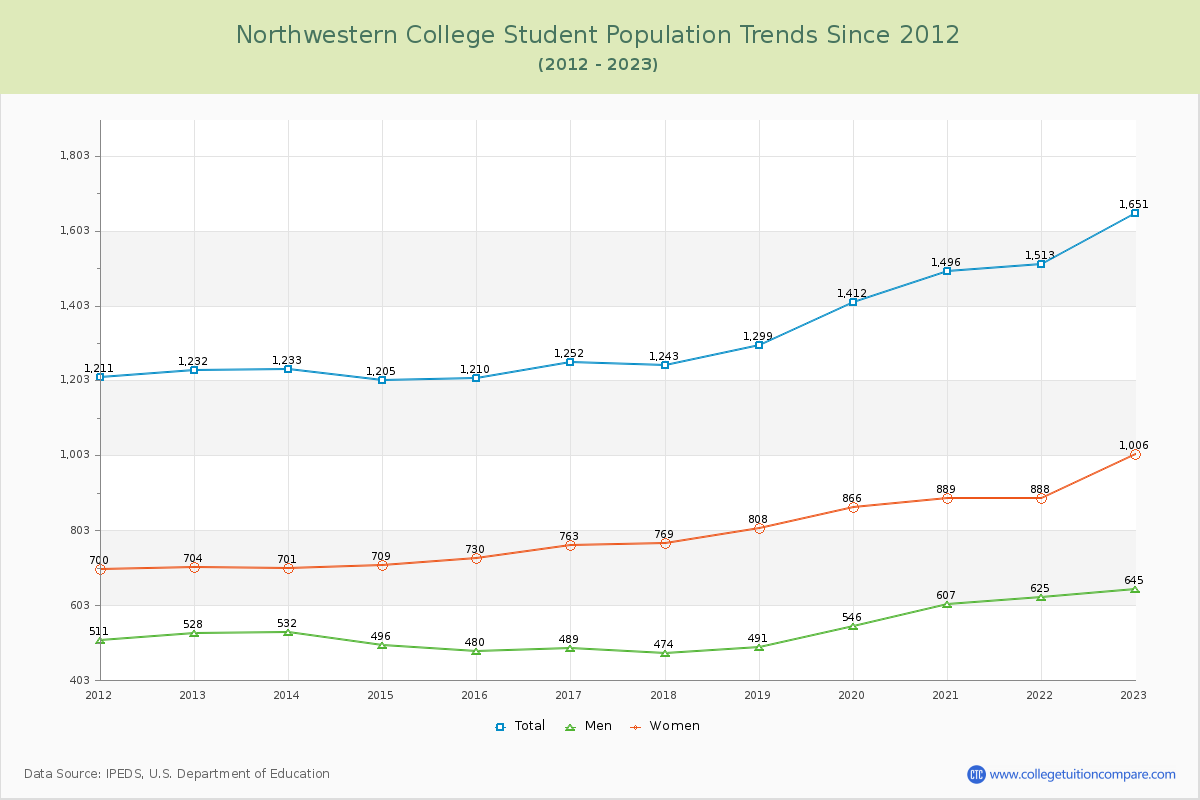
Student Population Changes
The average student population over the last 12 years is 1,341 where 1,651 students are attending the school for the academic year 2022-2023.
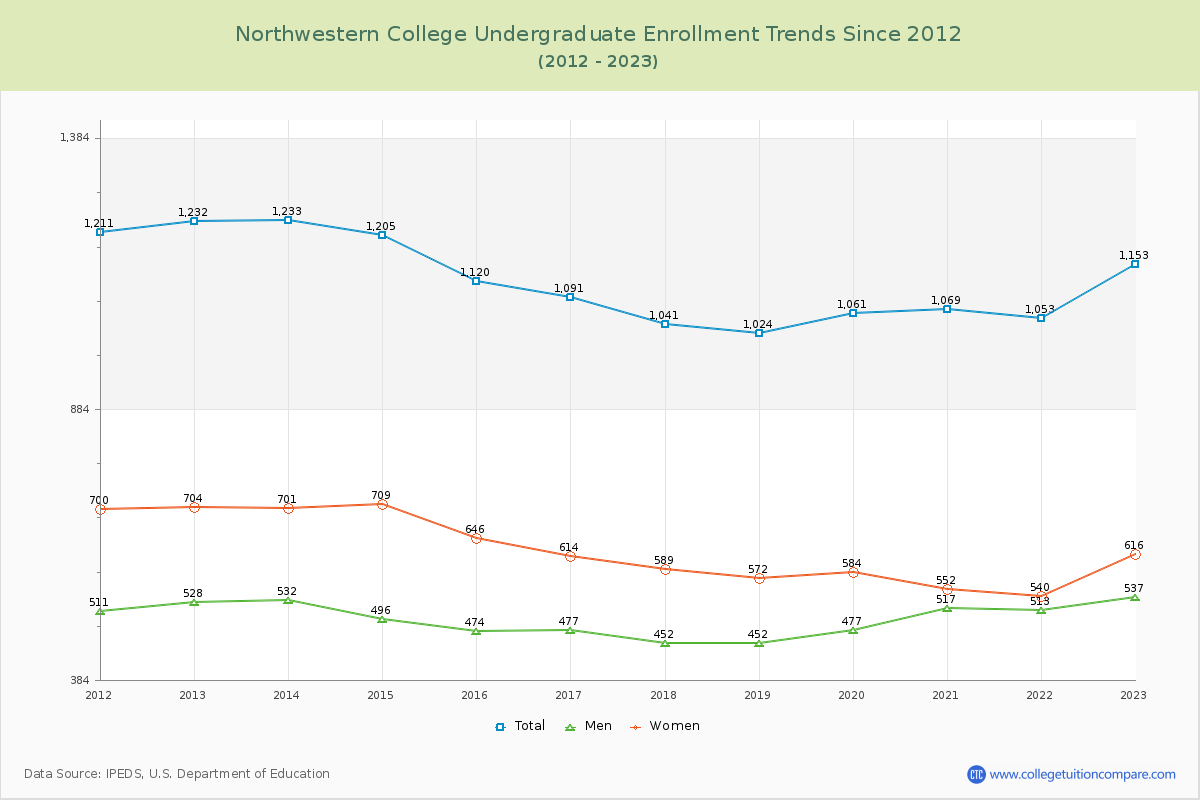
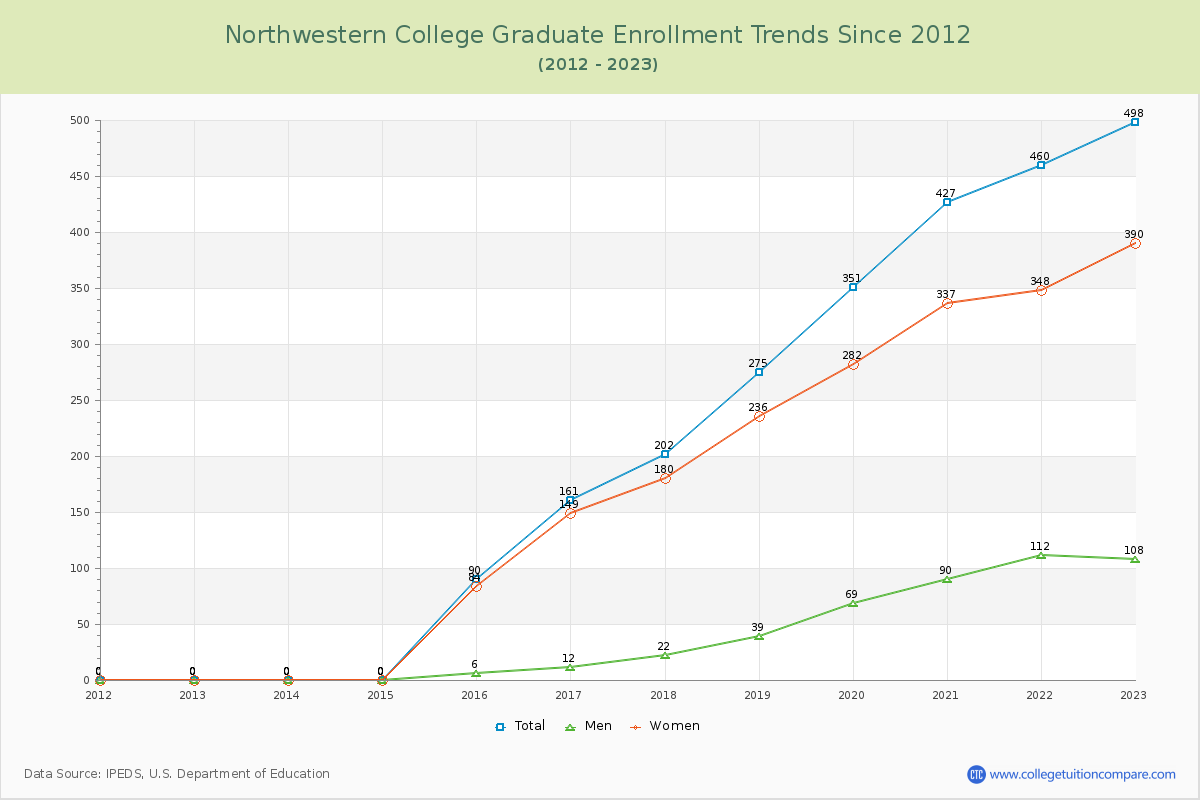
69.84% of total students is undergraduate students and 30.16% students is graduate students. The number of undergraduate students has decreased by 79 and the graduate enrollment has increased by 498 over past 10 years.
The female to male ratio is 1.56 to 1 and it means that there are more female students enrolled in Northwestern than male students.
The following table and chart illustrate the changes in student population by gender at Northwestern College since 2012.
| Year | Total | Undergraduate | Graduate | ||||
|---|---|---|---|---|---|---|---|
| Total | Men | Women | Total | Men | Women | ||
| 2012-13 | 1,232 | 1,232 | 528 | 704 | 0 | 0 | 0 |
| 2013-14 | 1,233 1 | 1,233 1 | 532 4 | 701 -3 | 0 0 | 0 0 | 0 0 |
| 2014-15 | 1,205 -28 | 1,205 -28 | 496 -36 | 709 8 | 0 0 | 0 0 | 0 0 |
| 2015-16 | 1,210 5 | 1,120 -85 | 474 -22 | 646 -63 | 90 90 | 6 6 | 84 84 |
| 2016-17 | 1,252 42 | 1,091 -29 | 477 3 | 614 -32 | 161 71 | 12 6 | 149 65 |
| 2017-18 | 1,243 -9 | 1,041 -50 | 452 -25 | 589 -25 | 202 41 | 22 10 | 180 31 |
| 2018-19 | 1,299 56 | 1,024 -17 | 452 0 | 572 -17 | 275 73 | 39 17 | 236 56 |
| 2019-20 | 1,412 113 | 1,061 37 | 477 25 | 584 12 | 351 76 | 69 30 | 282 46 |
| 2020-21 | 1,496 84 | 1,069 8 | 517 40 | 552 -32 | 427 76 | 90 21 | 337 55 |
| 2021-22 | 1,513 17 | 1,053 -16 | 513 -4 | 540 -12 | 460 33 | 112 22 | 348 11 |
| 2022-23 | 1,651 138 | 1,153 100 | 537 24 | 616 76 | 498 38 | 108 -4 | 390 42 |
| Average | 1,341 | 1,117 | 496 | 621 | 224 | 42 | 182 |