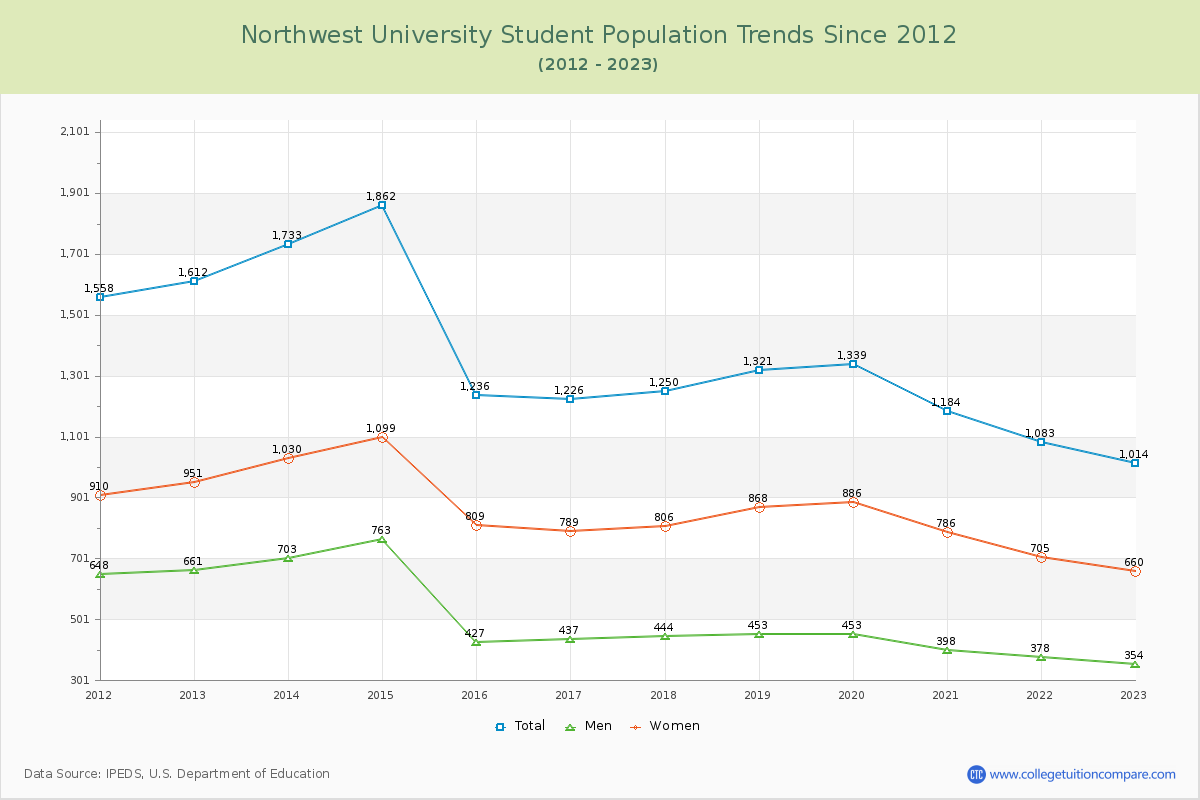
Student Population Changes
The average student population over the last 12 years is 1,351 where 1,014 students are attending the school for the academic year 2022-2023.
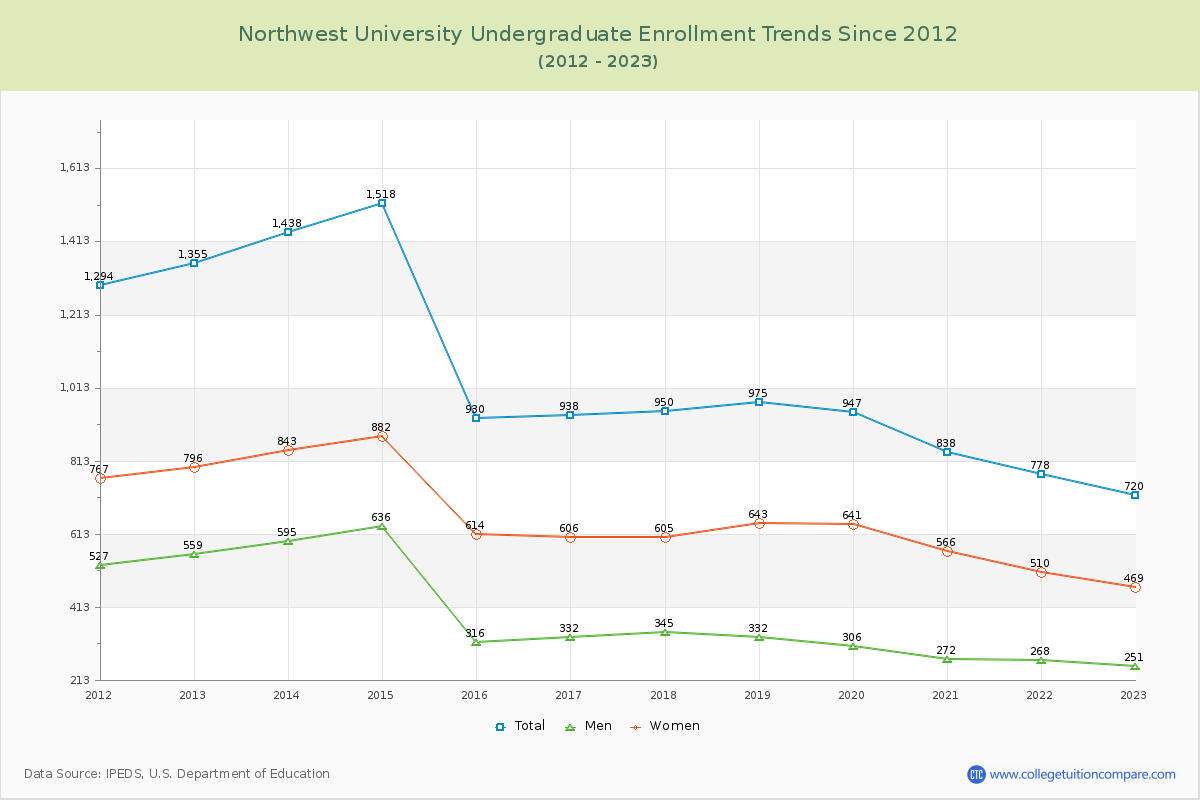
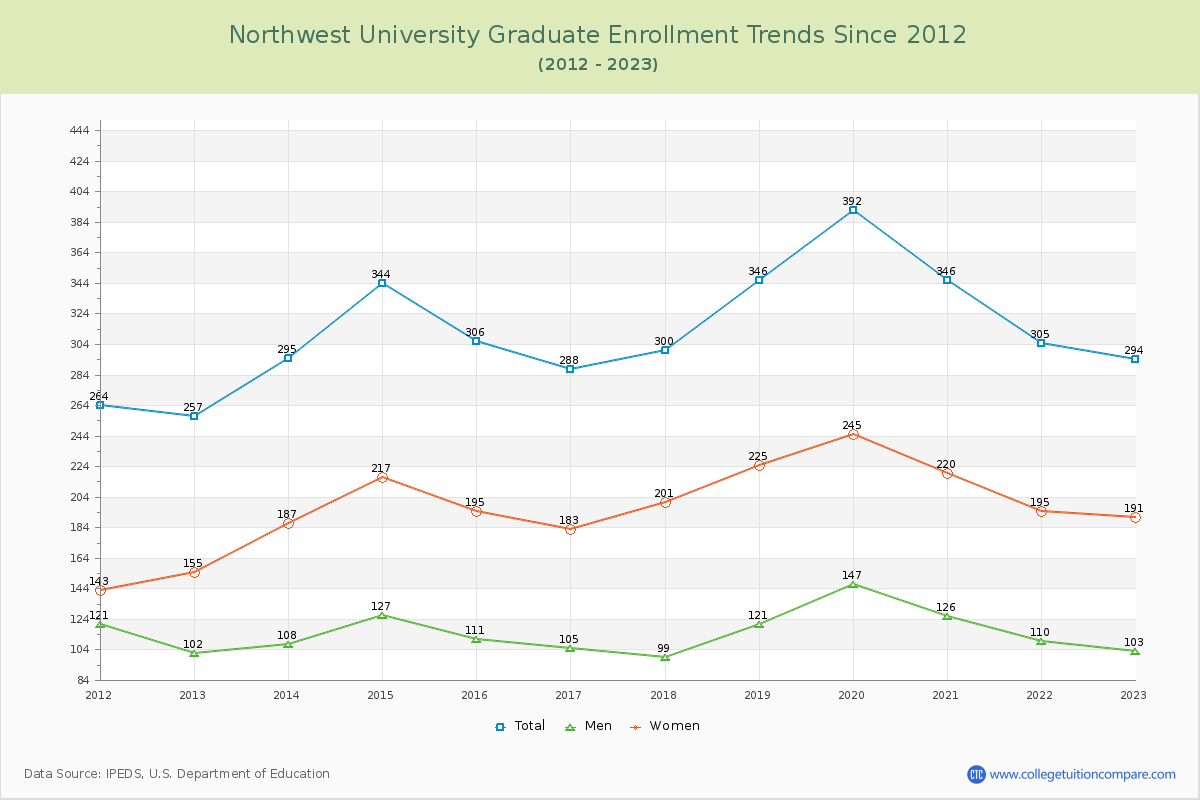
71.01% of total students is undergraduate students and 28.99% students is graduate students. The number of undergraduate students has decreased by 635 and the graduate enrollment has increased by 37 over past 10 years.
The female to male ratio is 1.86 to 1 and it means that there are more female students enrolled in Northwest than male students.
The following table and chart illustrate the changes in student population by gender at Northwest University since 2012.
| Year | Total | Undergraduate | Graduate | ||||
|---|---|---|---|---|---|---|---|
| Total | Men | Women | Total | Men | Women | ||
| 2012-13 | 1,612 | 1,355 | 559 | 796 | 257 | 102 | 155 |
| 2013-14 | 1,733 121 | 1,438 83 | 595 36 | 843 47 | 295 38 | 108 6 | 187 32 |
| 2014-15 | 1,862 129 | 1,518 80 | 636 41 | 882 39 | 344 49 | 127 19 | 217 30 |
| 2015-16 | 1,236 -626 | 930 -588 | 316 -320 | 614 -268 | 306 -38 | 111 -16 | 195 -22 |
| 2016-17 | 1,226 -10 | 938 8 | 332 16 | 606 -8 | 288 -18 | 105 -6 | 183 -12 |
| 2017-18 | 1,250 24 | 950 12 | 345 13 | 605 -1 | 300 12 | 99 -6 | 201 18 |
| 2018-19 | 1,321 71 | 975 25 | 332 -13 | 643 38 | 346 46 | 121 22 | 225 24 |
| 2019-20 | 1,339 18 | 947 -28 | 306 -26 | 641 -2 | 392 46 | 147 26 | 245 20 |
| 2020-21 | 1,184 -155 | 838 -109 | 272 -34 | 566 -75 | 346 -46 | 126 -21 | 220 -25 |
| 2021-22 | 1,083 -101 | 778 -60 | 268 -4 | 510 -56 | 305 -41 | 110 -16 | 195 -25 |
| 2022-23 | 1,014 -69 | 720 -58 | 251 -17 | 469 -41 | 294 -11 | 103 -7 | 191 -4 |
| Average | 1,351 | 1,035 | 383 | 652 | 316 | 114 | 201 |