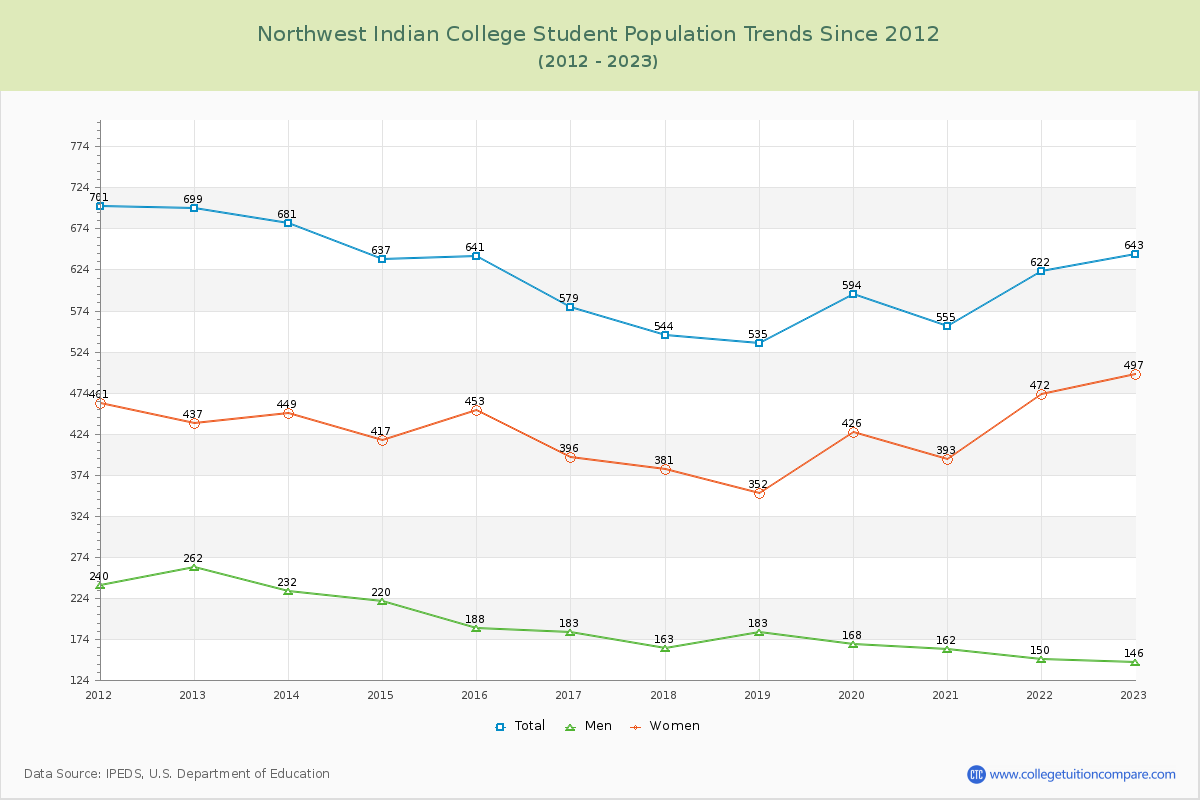
Student Population Changes
The average student population over the last 12 years is 612 where 643 students are attending the school for the academic year 2022-2023.
The female to male ratio is 3.40 to 1 and it means that there are far more female students enrolled in Northwest Indian than male students.
The following table and chart illustrate the changes in student population by gender at Northwest Indian College since 2012.
| Year | Total | Men | Women |
|---|---|---|---|
| 2012-13 | 699 | 262 | 437 |
| 2013-14 | 681 -18 | 232 -30 | 449 12 |
| 2014-15 | 637 -44 | 220 -12 | 417 -32 |
| 2015-16 | 641 4 | 188 -32 | 453 36 |
| 2016-17 | 579 -62 | 183 -5 | 396 -57 |
| 2017-18 | 544 -35 | 163 -20 | 381 -15 |
| 2018-19 | 535 -9 | 183 20 | 352 -29 |
| 2019-20 | 594 59 | 168 -15 | 426 74 |
| 2020-21 | 555 -39 | 162 -6 | 393 -33 |
| 2021-22 | 622 67 | 150 -12 | 472 79 |
| 2022-23 | 643 21 | 146 -4 | 497 25 |
| Average | 612 | 187 | 425 |