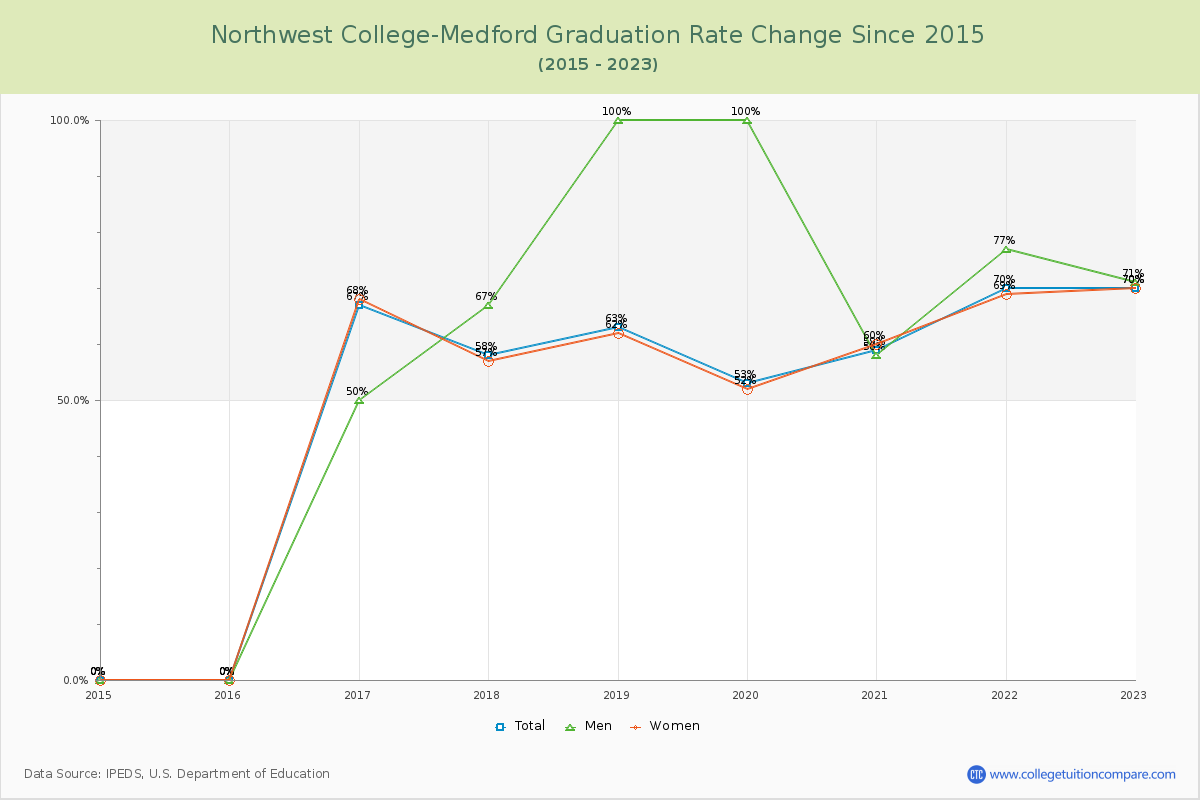
Graduation Rate Changes
The average graduation rate of the last 10 years is 48.89% where the current academic year rate is 70%.
The following table and chart show the changes of graduation rate at Northwest College-Medford over the past 10 years (2014-2023).
| Year | Total | Men | Women |
|---|---|---|---|
| 2014-15 | 0% | 0% | 0% |
| 2015-16 | 0% | 0% | 0% |
| 2016-17 | 67% | 50% | 68% |
| 2017-18 | 58% | 67% | 57% |
| 2018-19 | 63% | 100% | 62% |
| 2019-20 | 53% | 100% | 52% |
| 2020-21 | 59% | 58% | 60% |
| 2021-22 | 70% | 77% | 69% |
| 2022-23 | 70% | 71% | 70% |
| Average | 48.89% | 58.11% | 48.67% |