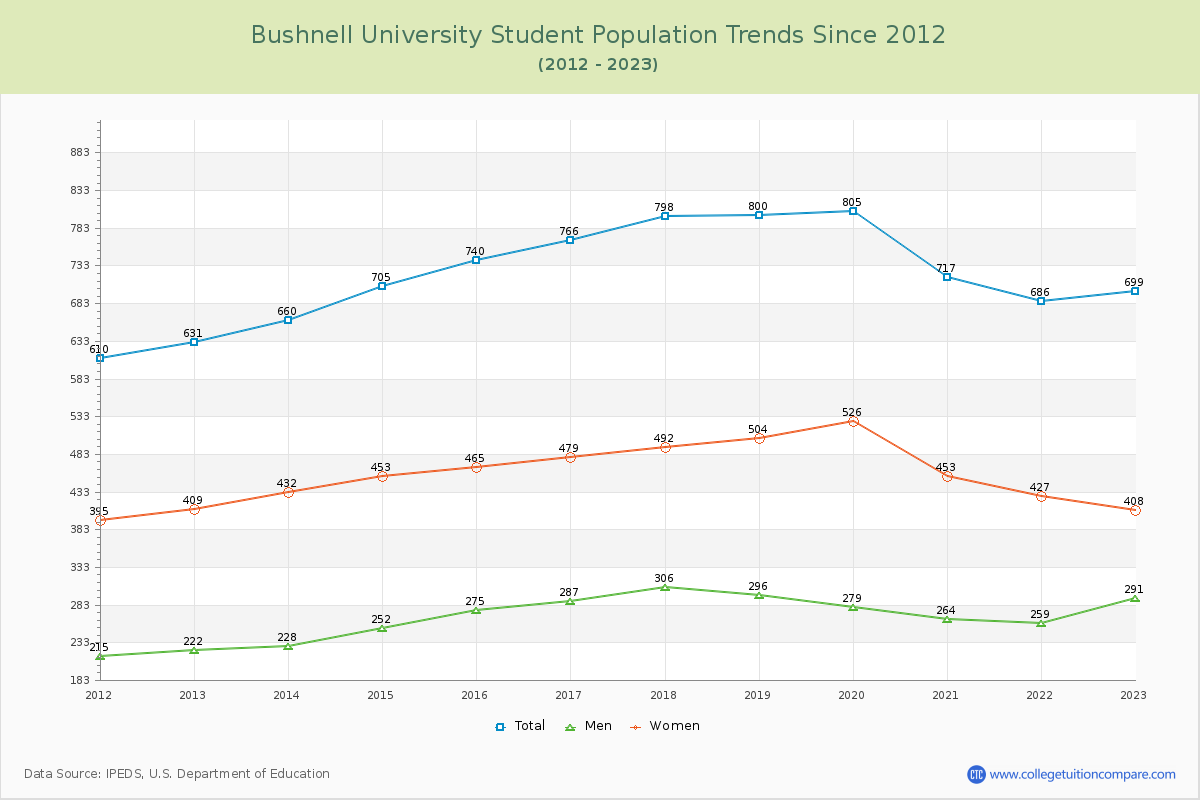
Student Population Changes
The average student population over the last 12 years is 728 where 699 students are attending the school for the academic year 2022-2023.
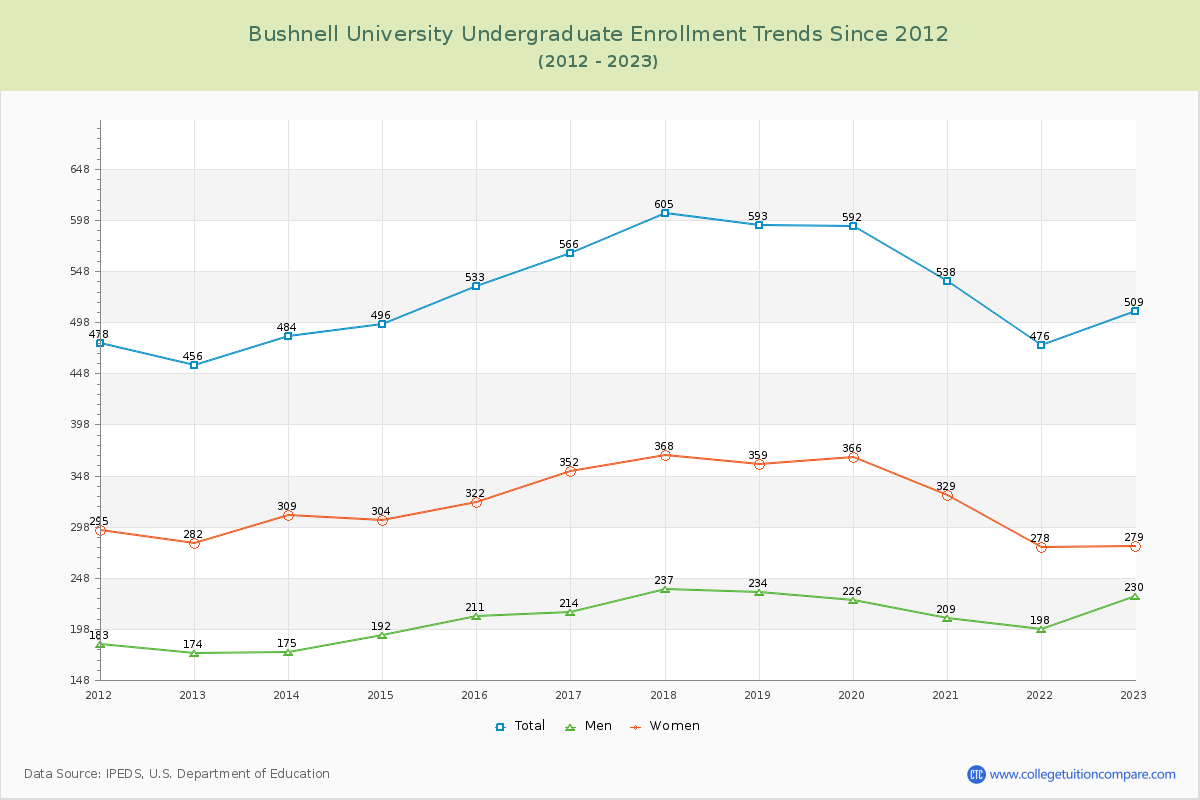
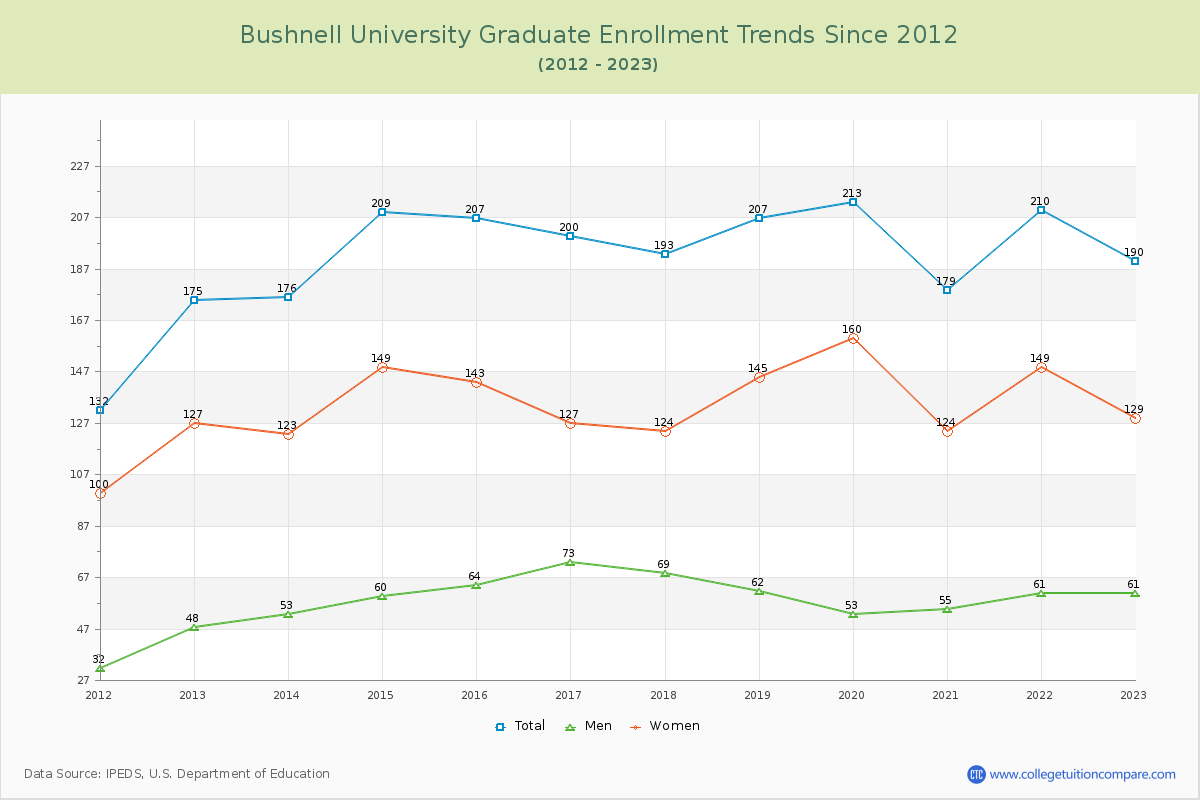
72.82% of total students is undergraduate students and 27.18% students is graduate students. The number of undergraduate students has increased by 53 and the graduate enrollment has increased by 15 over past 10 years.
The female to male ratio is 1.40 to 1 and it means that there are more female students enrolled in NCU than male students.
The following table and chart illustrate the changes in student population by gender at Bushnell University since 2012.
| Year | Total | Undergraduate | Graduate | ||||
|---|---|---|---|---|---|---|---|
| Total | Men | Women | Total | Men | Women | ||
| 2012-13 | 631 | 456 | 174 | 282 | 175 | 48 | 127 |
| 2013-14 | 660 29 | 484 28 | 175 1 | 309 27 | 176 1 | 53 5 | 123 -4 |
| 2014-15 | 705 45 | 496 12 | 192 17 | 304 -5 | 209 33 | 60 7 | 149 26 |
| 2015-16 | 740 35 | 533 37 | 211 19 | 322 18 | 207 -2 | 64 4 | 143 -6 |
| 2016-17 | 766 26 | 566 33 | 214 3 | 352 30 | 200 -7 | 73 9 | 127 -16 |
| 2017-18 | 798 32 | 605 39 | 237 23 | 368 16 | 193 -7 | 69 -4 | 124 -3 |
| 2018-19 | 800 2 | 593 -12 | 234 -3 | 359 -9 | 207 14 | 62 -7 | 145 21 |
| 2019-20 | 805 5 | 592 -1 | 226 -8 | 366 7 | 213 6 | 53 -9 | 160 15 |
| 2020-21 | 717 -88 | 538 -54 | 209 -17 | 329 -37 | 179 -34 | 55 2 | 124 -36 |
| 2021-22 | 686 -31 | 476 -62 | 198 -11 | 278 -51 | 210 31 | 61 6 | 149 25 |
| 2022-23 | 699 13 | 509 33 | 230 32 | 279 1 | 190 -20 | 61 0 | 129 -20 |
| Average | 728 | 532 | 209 | 323 | 196 | 60 | 136 |