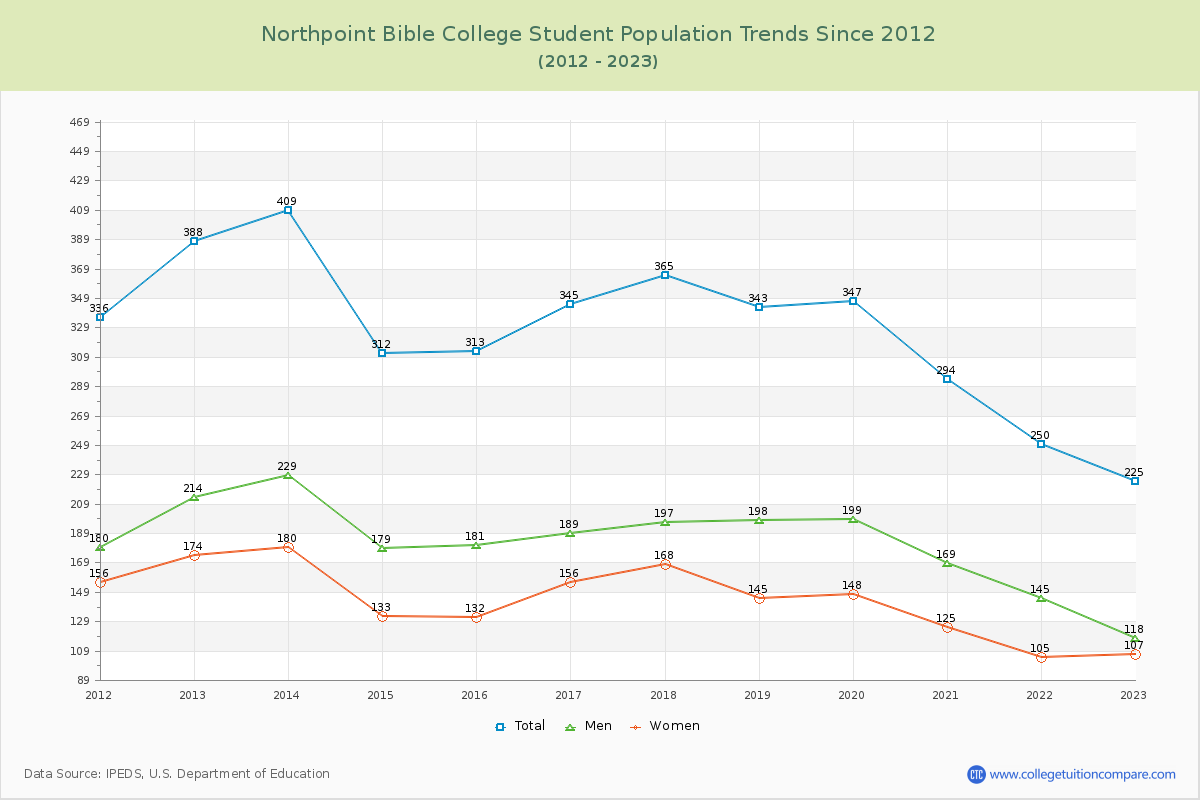
Student Population Changes
The average student population over the last 12 years is 326 where 225 students are attending the school for the academic year 2022-2023.
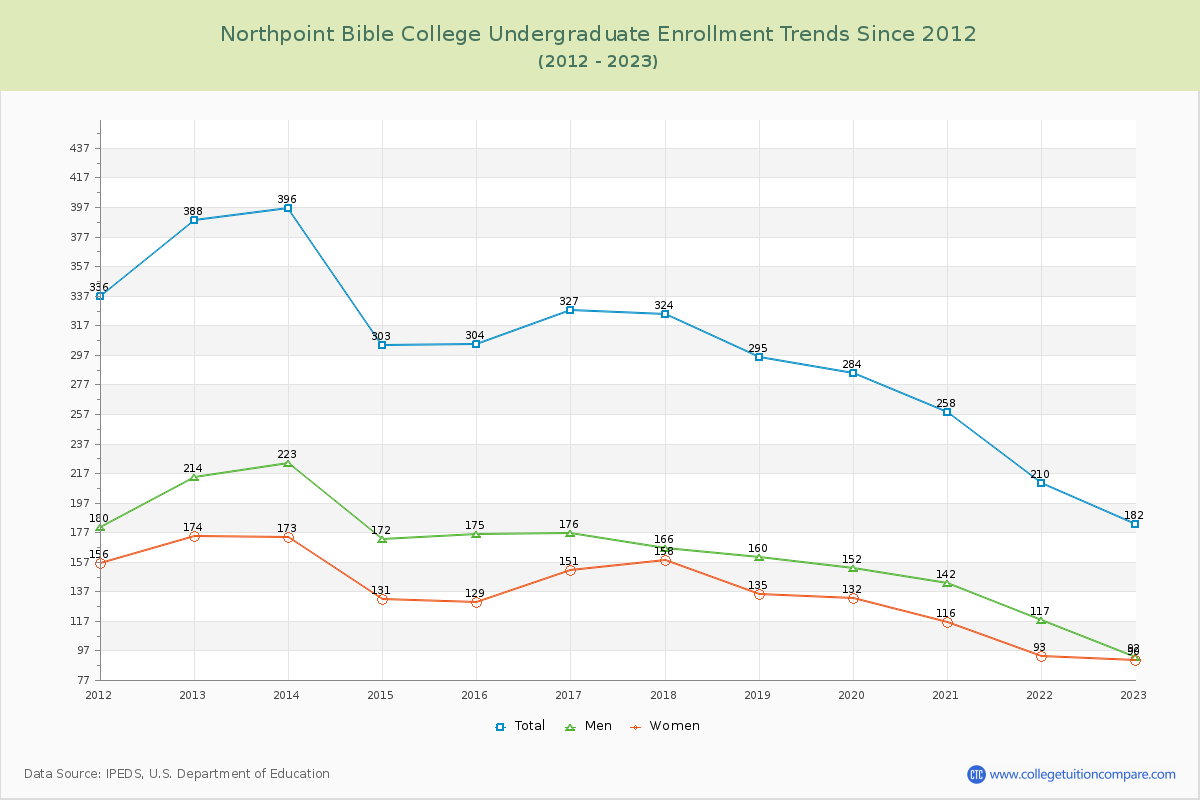
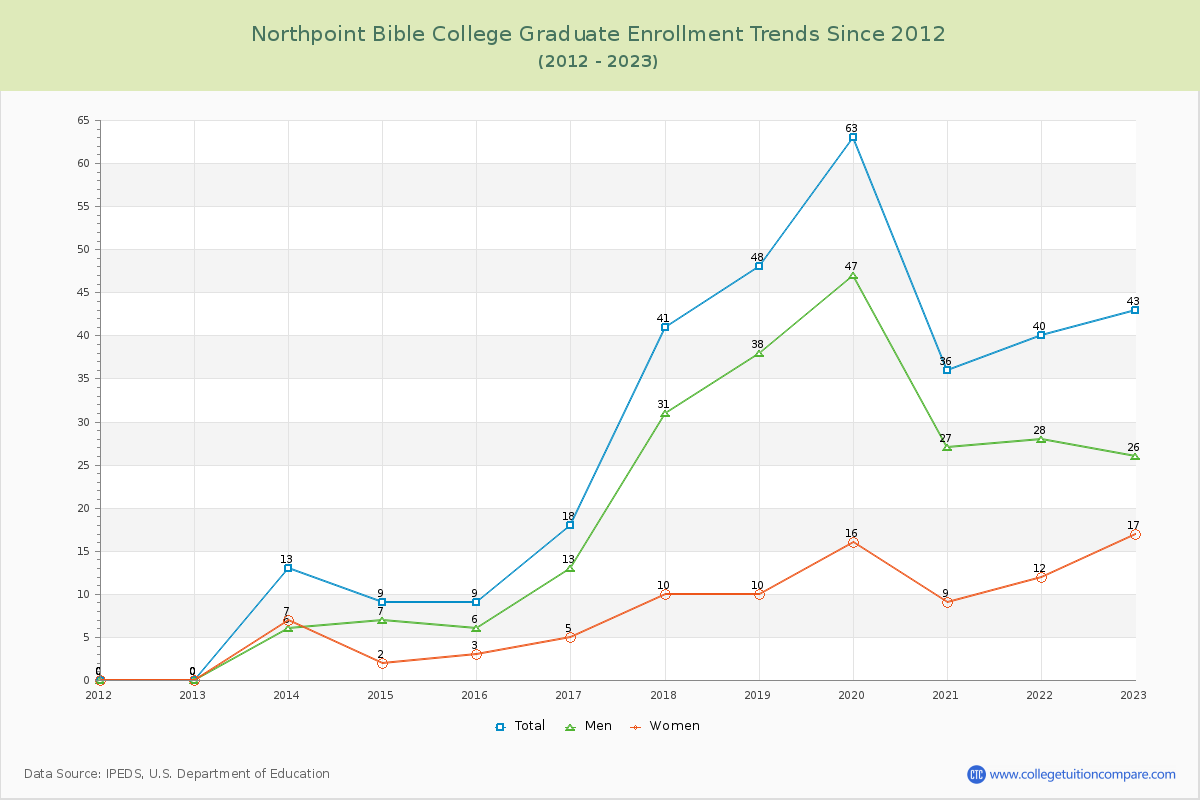
80.89% of total students is undergraduate students and 19.11% students is graduate students. The number of undergraduate students has decreased by 206 and the graduate enrollment has increased by 43 over past 10 years.
The female to male ratio is 0.91 to 1 and it means that there are similar numbers of female and male students enrolled in Northpoint Bible.
The following table and chart illustrate the changes in student population by gender at Northpoint Bible College since 2012.
| Year | Total | Undergraduate | Graduate | ||||
|---|---|---|---|---|---|---|---|
| Total | Men | Women | Total | Men | Women | ||
| 2012-13 | 388 | 388 | 214 | 174 | 0 | 0 | 0 |
| 2013-14 | 409 21 | 396 8 | 223 9 | 173 -1 | 13 13 | 6 6 | 7 7 |
| 2014-15 | 312 -97 | 303 -93 | 172 -51 | 131 -42 | 9 -4 | 7 1 | 2 -5 |
| 2015-16 | 313 1 | 304 1 | 175 3 | 129 -2 | 9 0 | 6 -1 | 3 1 |
| 2016-17 | 345 32 | 327 23 | 176 1 | 151 22 | 18 9 | 13 7 | 5 2 |
| 2017-18 | 365 20 | 324 -3 | 166 -10 | 158 7 | 41 23 | 31 18 | 10 5 |
| 2018-19 | 343 -22 | 295 -29 | 160 -6 | 135 -23 | 48 7 | 38 7 | 10 0 |
| 2019-20 | 347 4 | 284 -11 | 152 -8 | 132 -3 | 63 15 | 47 9 | 16 6 |
| 2020-21 | 294 -53 | 258 -26 | 142 -10 | 116 -16 | 36 -27 | 27 -20 | 9 -7 |
| 2021-22 | 250 -44 | 210 -48 | 117 -25 | 93 -23 | 40 4 | 28 1 | 12 3 |
| 2022-23 | 225 -25 | 182 -28 | 92 -25 | 90 -3 | 43 3 | 26 -2 | 17 5 |
| Average | 326 | 297 | 163 | 135 | 29 | 21 | 8 |