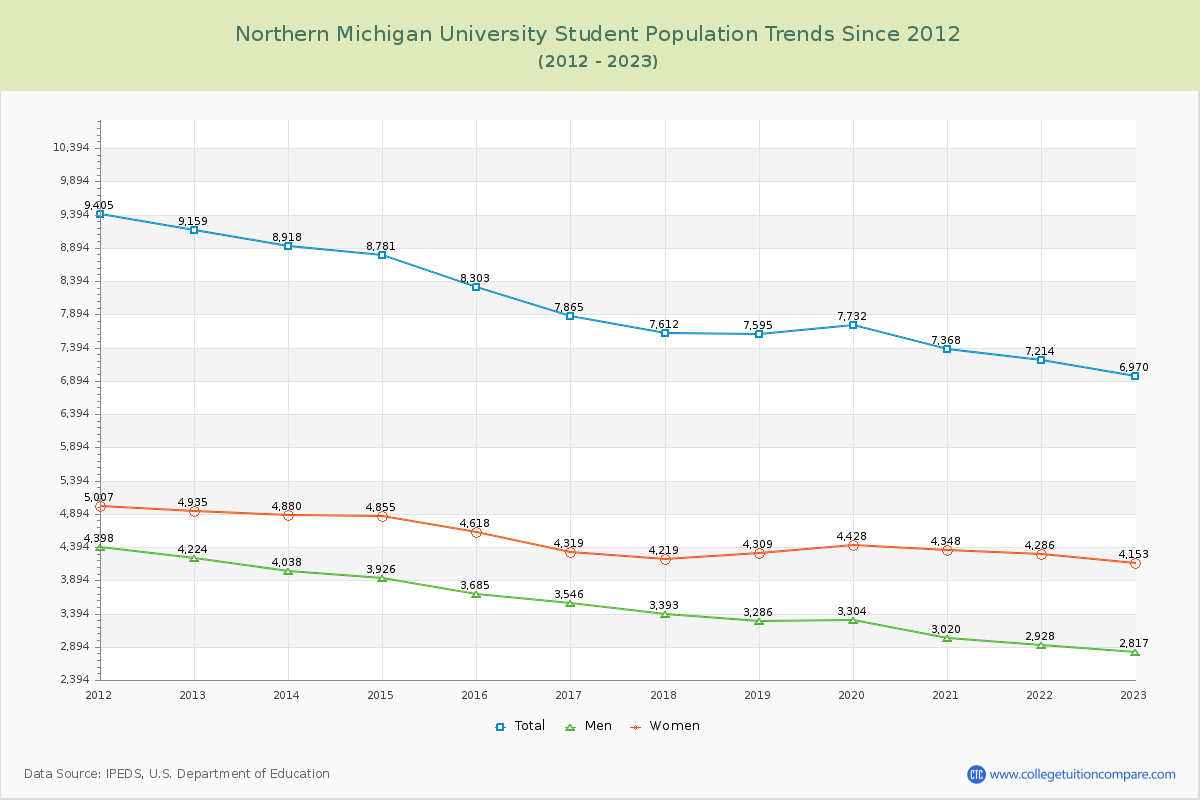
Student Population Changes
The average student population over the last 12 years is 7,956 where 6,970 students are attending the school for the academic year 2022-2023.
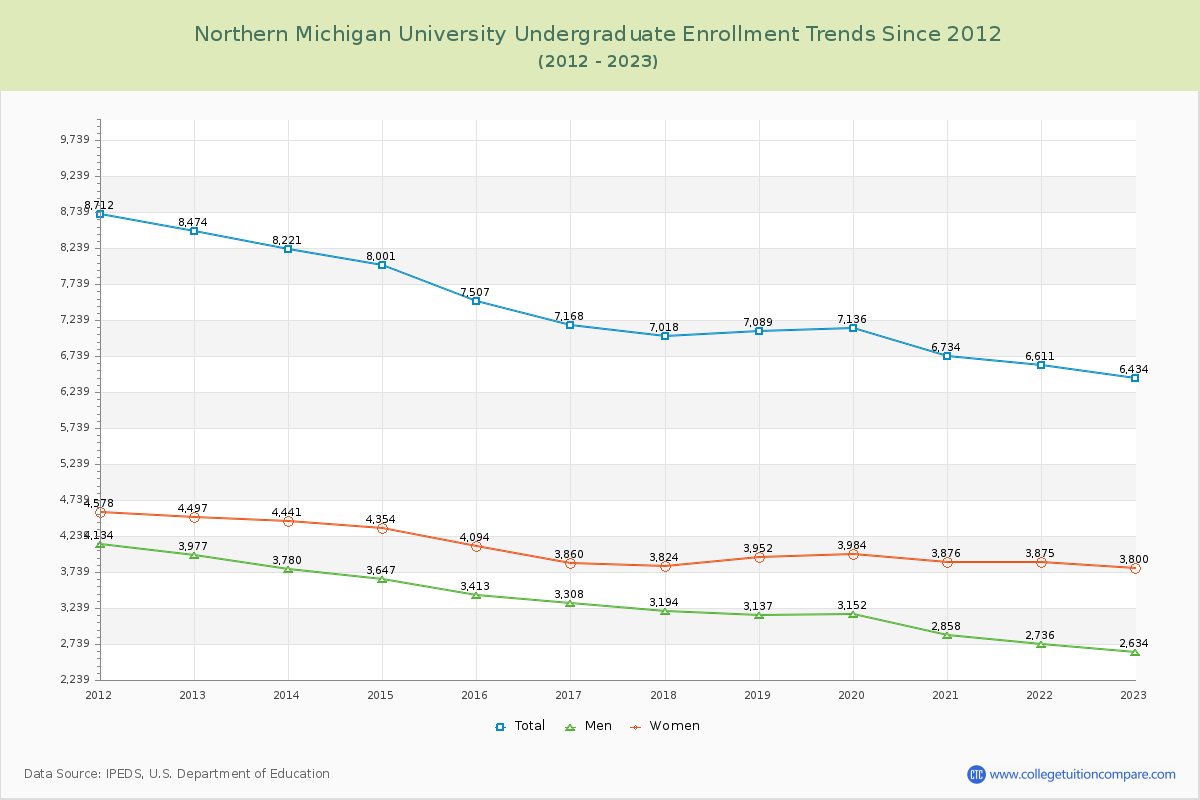
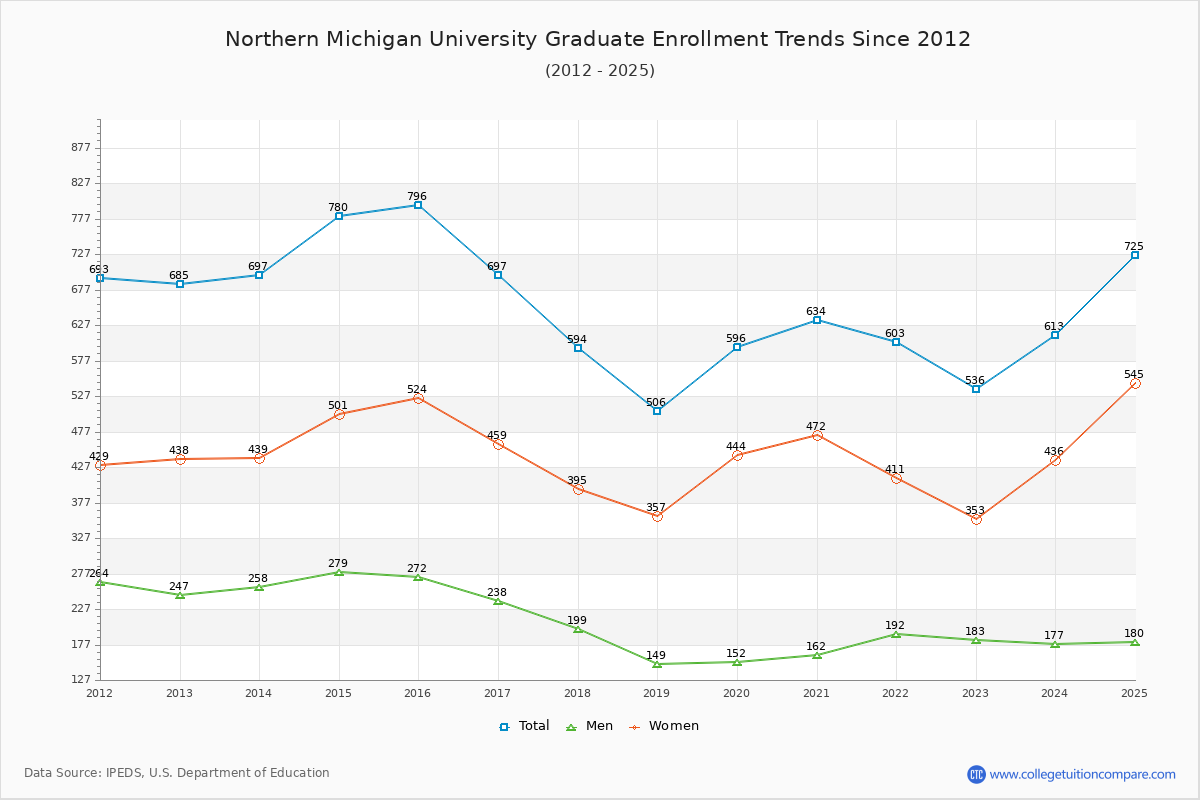
92.31% of total students is undergraduate students and 7.69% students is graduate students. The number of undergraduate students has decreased by 2,040 and the graduate enrollment has decreased by 149 over past 10 years.
The female to male ratio is 1.47 to 1 and it means that there are more female students enrolled in Northern Michigan than male students.
The following table and chart illustrate the changes in student population by gender at Northern Michigan University since 2012.
| Year | Total | Undergraduate | Graduate | ||||
|---|---|---|---|---|---|---|---|
| Total | Men | Women | Total | Men | Women | ||
| 2012-13 | 9,159 | 8,474 | 3,977 | 4,497 | 685 | 247 | 438 |
| 2013-14 | 8,918 -241 | 8,221 -253 | 3,780 -197 | 4,441 -56 | 697 12 | 258 11 | 439 1 |
| 2014-15 | 8,781 -137 | 8,001 -220 | 3,647 -133 | 4,354 -87 | 780 83 | 279 21 | 501 62 |
| 2015-16 | 8,303 -478 | 7,507 -494 | 3,413 -234 | 4,094 -260 | 796 16 | 272 -7 | 524 23 |
| 2016-17 | 7,865 -438 | 7,168 -339 | 3,308 -105 | 3,860 -234 | 697 -99 | 238 -34 | 459 -65 |
| 2017-18 | 7,612 -253 | 7,018 -150 | 3,194 -114 | 3,824 -36 | 594 -103 | 199 -39 | 395 -64 |
| 2018-19 | 7,595 -17 | 7,089 71 | 3,137 -57 | 3,952 128 | 506 -88 | 149 -50 | 357 -38 |
| 2019-20 | 7,732 137 | 7,136 47 | 3,152 15 | 3,984 32 | 596 90 | 152 3 | 444 87 |
| 2020-21 | 7,368 -364 | 6,734 -402 | 2,858 -294 | 3,876 -108 | 634 38 | 162 10 | 472 28 |
| 2021-22 | 7,214 -154 | 6,611 -123 | 2,736 -122 | 3,875 -1 | 603 -31 | 192 30 | 411 -61 |
| 2022-23 | 6,970 -244 | 6,434 -177 | 2,634 -102 | 3,800 -75 | 536 -67 | 183 -9 | 353 -58 |
| Average | 7,956 | 7,308 | 3,258 | 4,051 | 648 | 212 | 436 |