Enrollment Trends at NACC

508

Total Enrollment

169

Men

339

Women

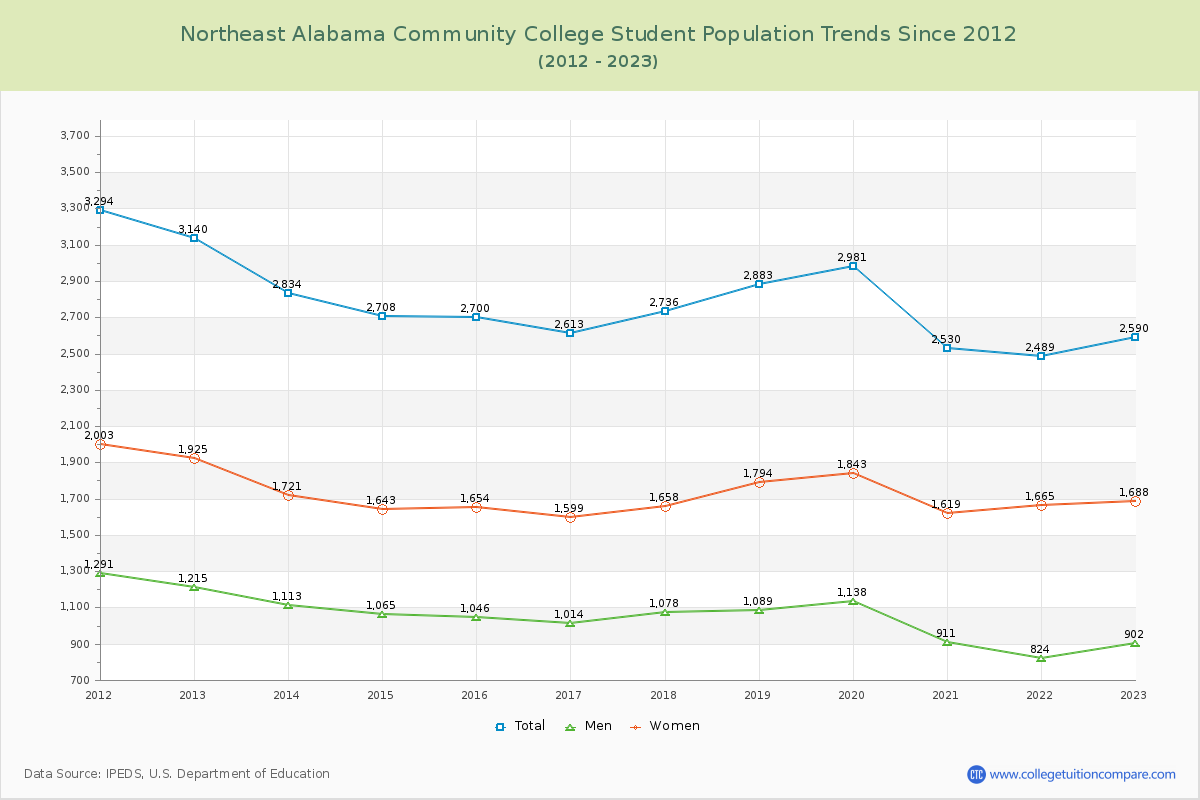
The student population at Northeast Alabama Community College is 3,208 (all undergraduate). The number of students has increased by 508 over the past decade.

The female to male ratio is 1.64 to 1 which means that female students enrolled more than male students.

835 students enrolled in online degree program exclusively and the number of online students has increased by 246.47% since 2015.

Student Population Changes

The average student population over the last 11 years is 2,764 where 3,208 students are attending the school for the academic year 2024-2025.

The female to male ratio is 1.64 to 1 and it means that there are more female students enrolled in NACC than male students.

The following table and chart illustrate the changes in student population by gender at Northeast Alabama Community College since 2015.

YearTotalMenWomen
2015-162,7001,0461,654
2016-172,613
-87
1,014
-32
1,599
-55
2017-182,736
123
1,078
64
1,658
59
2018-192,883
147
1,089
11
1,794
136
2019-202,981
98
1,138
49
1,843
49
2020-212,530
-451
911
-227
1,619
-224
2021-222,489
-41
824
-87
1,665
46
2022-232,590
101
902
78
1,688
23
2023-242,905
315
1,116
214
1,789
101
2024-253,208
303
1,215
99
1,993
204
Average2,7641,0331,730
Northeast Alabama Community College Enrollment Trends Chart

Enrollment by Race/Ethnicity Changes

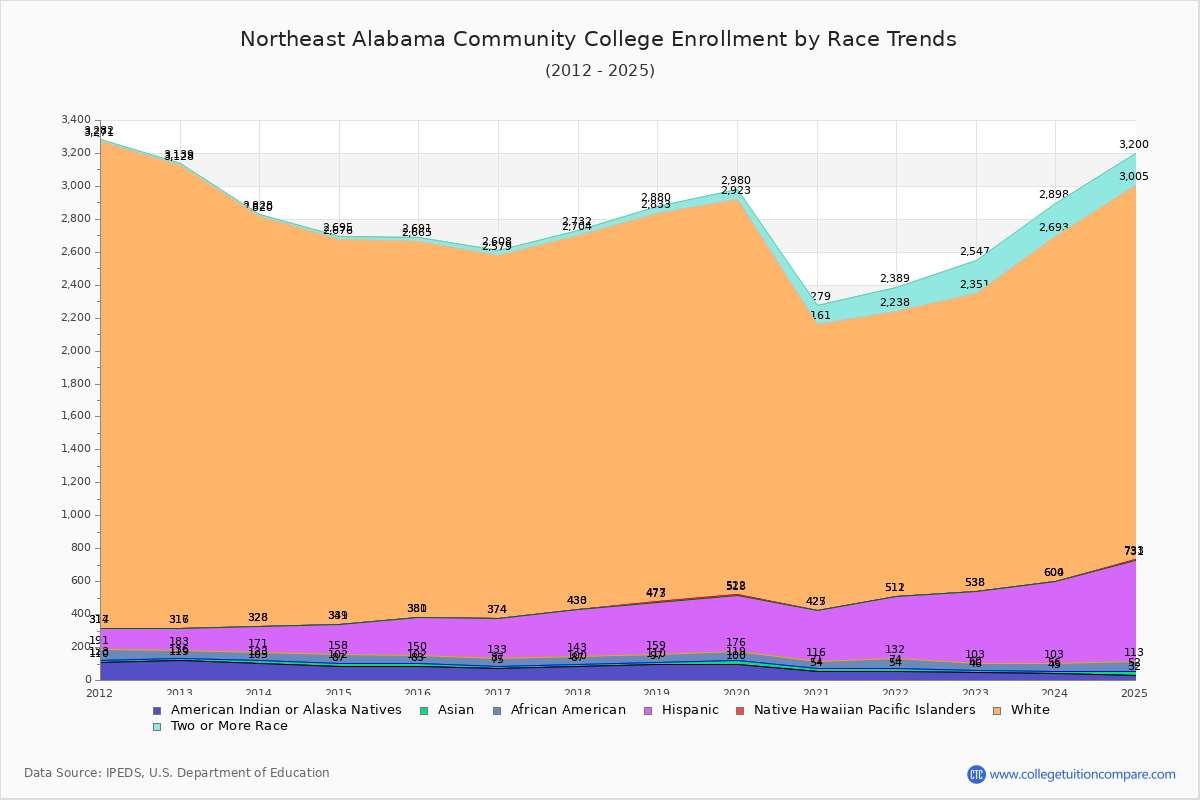
The percentage of white students is 70.82%. The percentage was 84.59% 10 years ago and NACC still has a high percentage of white students. 0.62% of enrolled students is Asian and 1.90% is black students. Hispanic students comprise 19.26% of the student body.

Over the past 10 years, the racial composition has shifted. The percentage of white students decreased from 84.59% to 70.82%. Asian enrollment declined from 0.70% to 0.62%. Black student enrollment increased from 1.78% to 1.90%. Hispanic student representation expanded from 8.52% to 19.26%.

The overall racial diversity, measured by the Census Bureau Diversity Index, is 0.4571 which indicates that somewhat diverse. This increased from 0.2757 a decade ago, suggesting that racial diversity has improved.

The following table and chart illustrate the student population trends by race/ethnicity at Northeast Alabama Community College over the past 11 years (2015-2025).

YearAmerican Indian or Native AmericanAsianBlackHispanicNative Hawaiian or Other Pacific IslanderWhiteTwo or More Races
2015-1683194823012,28426
2016-1775124624102,20529
2017-1887134328732,27128
2018-1997134931442,35647
2019-20100195734242,40157
2020-2154174530921,734118
2021-2254205837911,726151
2022-2346144343501,813196
2023-2445114749742,089205
2024-2532206161822,272195
Average67165036522,115105
Northeast Alabama Community College Enrollment by Race Trends Chart

Distance Learning (Online Courses) Enrollment Changes

835 students are enrolled in online degree programs exclusively for the academic year 2024-2025, which is 26% of total students. The number of online students has increased 246.47% since 2015. The following table and chart illustrate the changes in the online student population by enrolled type at Northeast Alabama Community College from 2015 to 2025.

YearTotal EnrollmentOnline CompletelyEnrolled in Some Online CoursesNot Enrolled in Online Courses
2015-162,7002419691,490
2016-172,6132811,0081,324
2017-182,7363961,0151,325
2018-192,8834331,2011,249
2019-202,9815581,2601,163
2020-212,5301,549534447
2021-222,4897561,043690
2022-232,5908071,086697
2023-242,9059529361,017
2024-253,2088358601,513
Average2,7646819911,092

Ratings & Review

Share your experiences and thoughts about Northeast Alabama Community College. It will be a great help to applicants and prospective students!