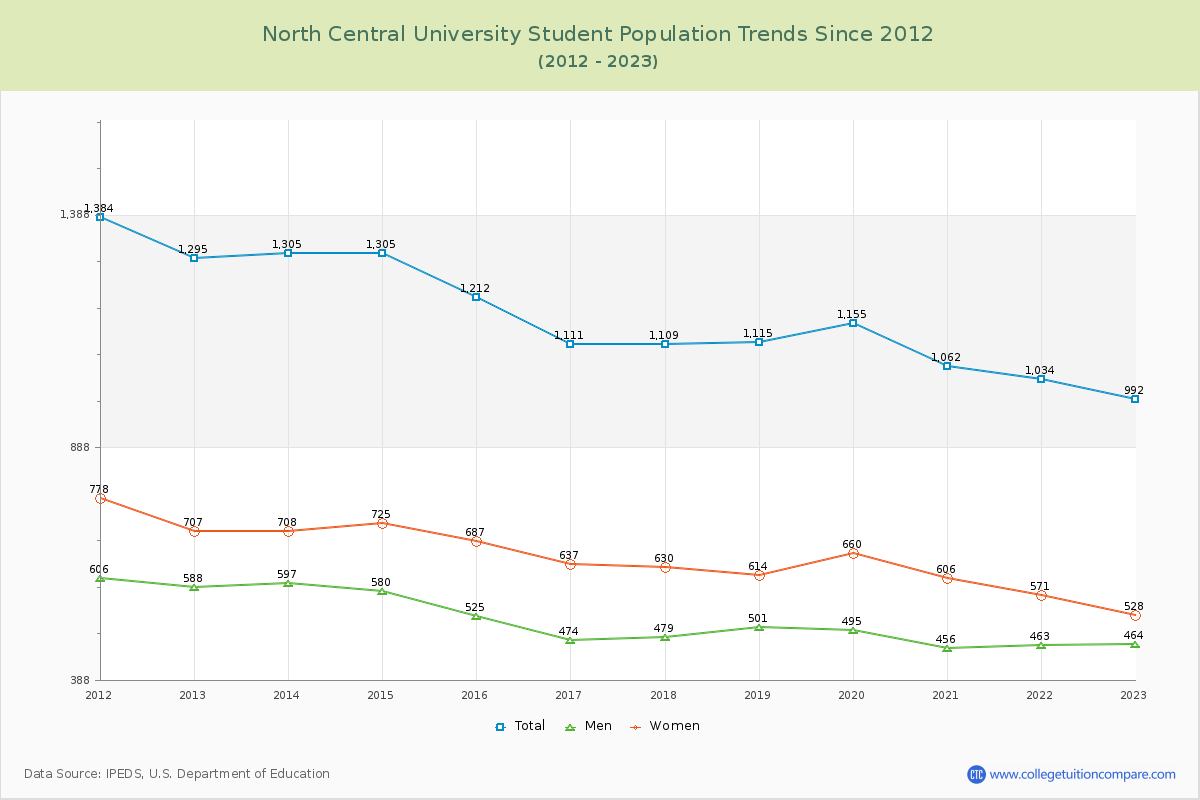
Student Population Changes
The average student population over the last 12 years is 1,154 where 992 students are attending the school for the academic year 2022-2023.
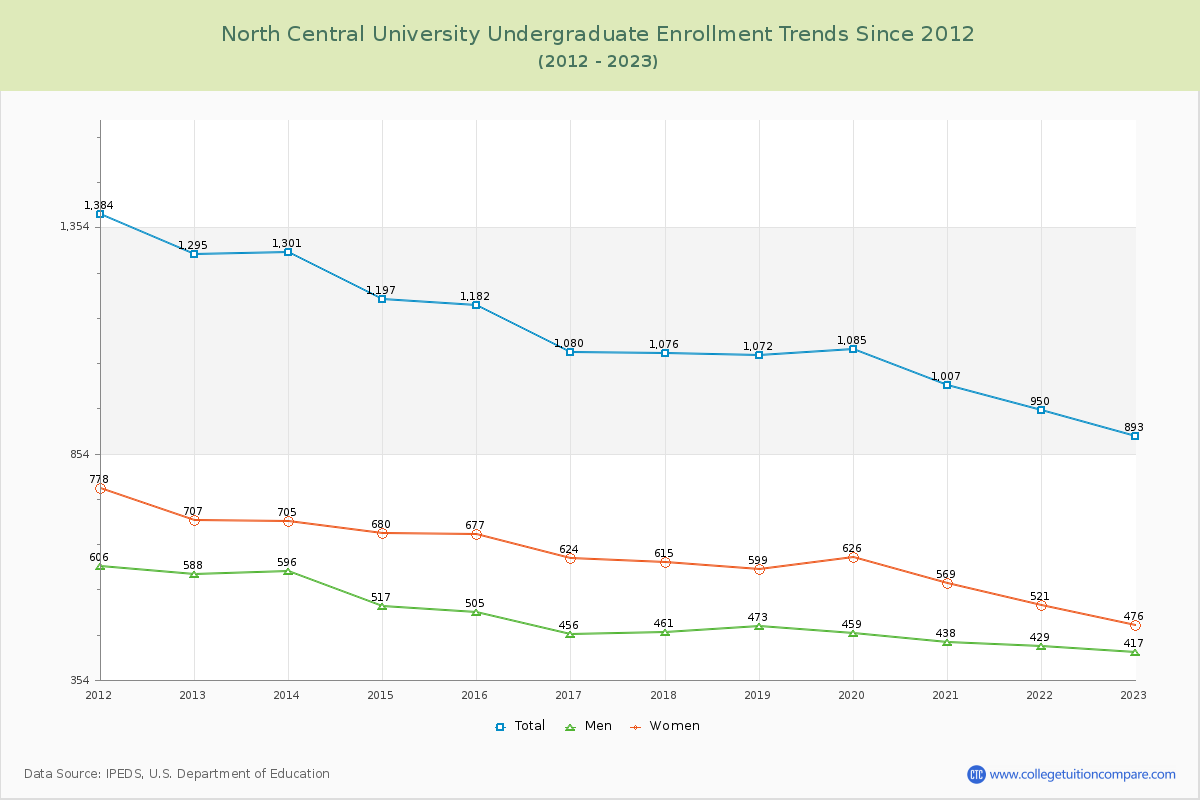
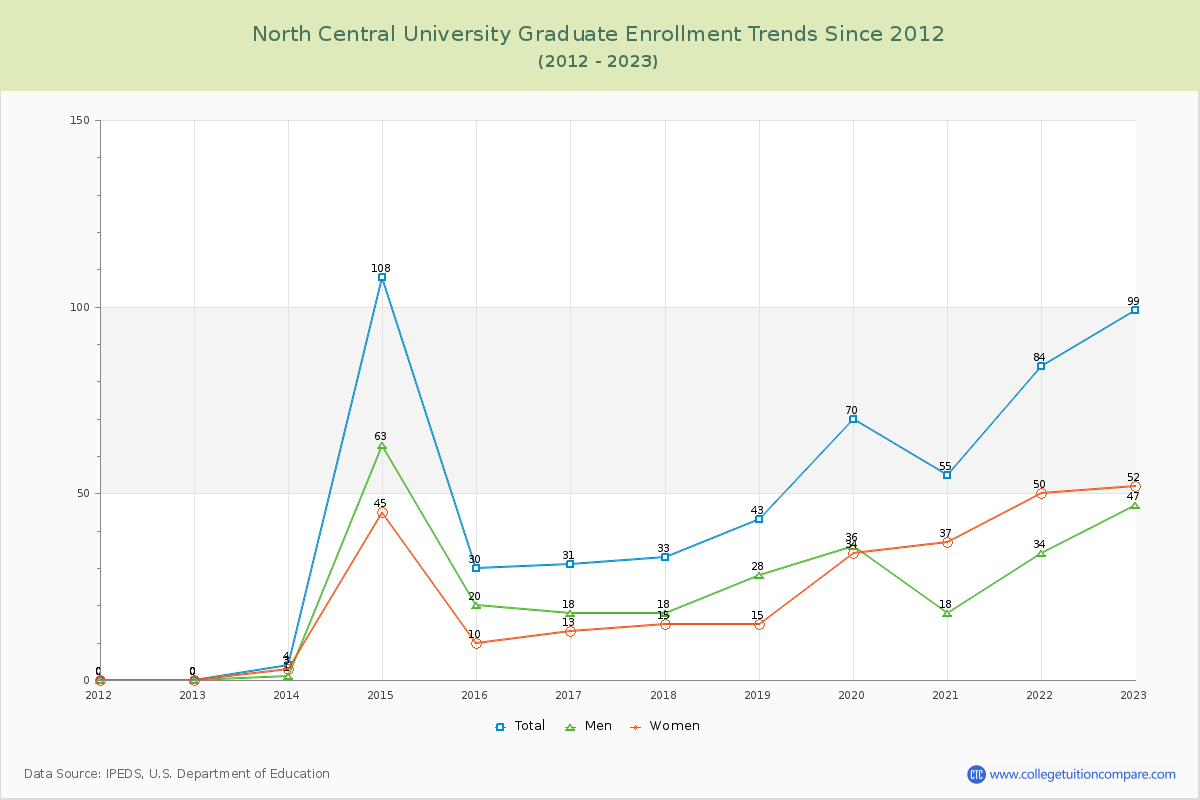
90.02% of total students is undergraduate students and 9.98% students is graduate students. The number of undergraduate students has decreased by 402 and the graduate enrollment has increased by 99 over past 10 years.
The female to male ratio is 1.14 to 1 and it means that there are slightly more female students enrolled in North Central than male students.
The following table and chart illustrate the changes in student population by gender at North Central University since 2012.
| Year | Total | Undergraduate | Graduate | ||||
|---|---|---|---|---|---|---|---|
| Total | Men | Women | Total | Men | Women | ||
| 2012-13 | 1,295 | 1,295 | 588 | 707 | 0 | 0 | 0 |
| 2013-14 | 1,305 10 | 1,301 6 | 596 8 | 705 -2 | 4 4 | 1 1 | 3 3 |
| 2014-15 | 1,305 0 | 1,197 -104 | 517 -79 | 680 -25 | 108 104 | 63 62 | 45 42 |
| 2015-16 | 1,212 -93 | 1,182 -15 | 505 -12 | 677 -3 | 30 -78 | 20 -43 | 10 -35 |
| 2016-17 | 1,111 -101 | 1,080 -102 | 456 -49 | 624 -53 | 31 1 | 18 -2 | 13 3 |
| 2017-18 | 1,109 -2 | 1,076 -4 | 461 5 | 615 -9 | 33 2 | 18 0 | 15 2 |
| 2018-19 | 1,115 6 | 1,072 -4 | 473 12 | 599 -16 | 43 10 | 28 10 | 15 0 |
| 2019-20 | 1,155 40 | 1,085 13 | 459 -14 | 626 27 | 70 27 | 36 8 | 34 19 |
| 2020-21 | 1,062 -93 | 1,007 -78 | 438 -21 | 569 -57 | 55 -15 | 18 -18 | 37 3 |
| 2021-22 | 1,034 -28 | 950 -57 | 429 -9 | 521 -48 | 84 29 | 34 16 | 50 13 |
| 2022-23 | 992 -42 | 893 -57 | 417 -12 | 476 -45 | 99 15 | 47 13 | 52 2 |
| Average | 1,154 | 1,103 | 485 | 618 | 51 | 26 | 25 |