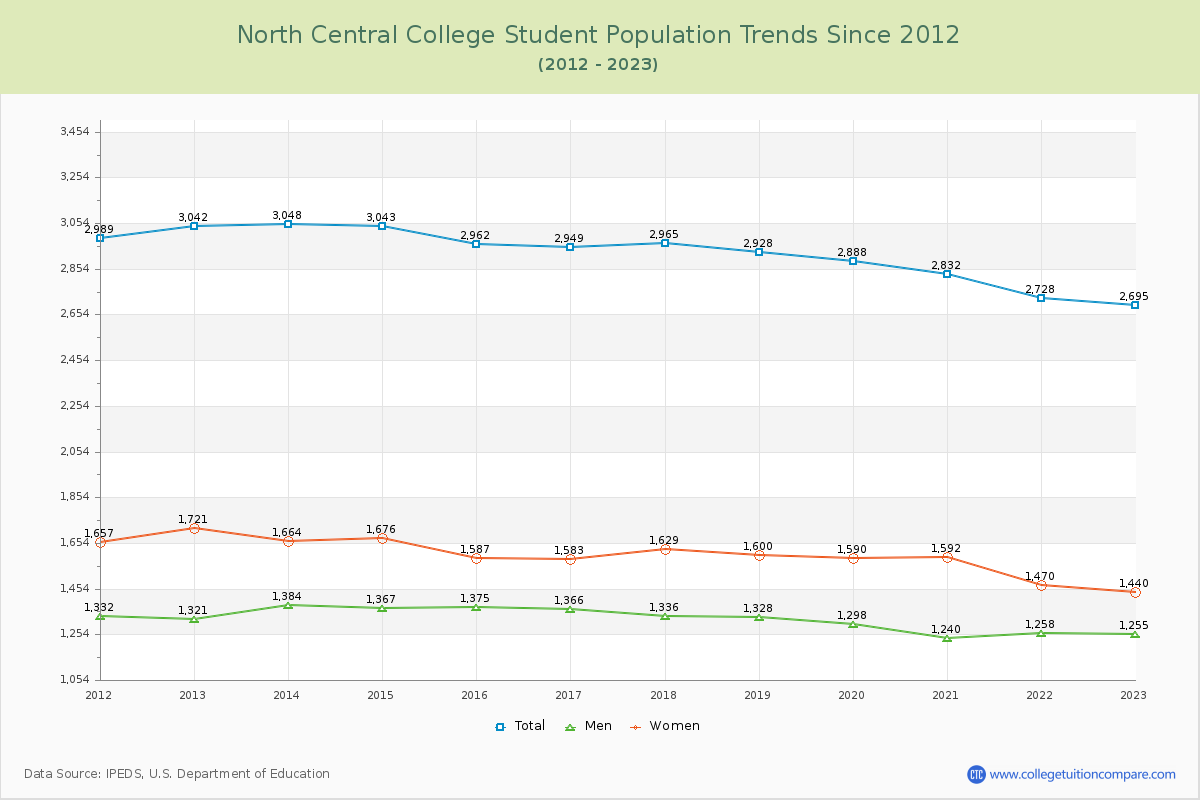
Student Population Changes
The average student population over the last 12 years is 2,916 where 2,695 students are attending the school for the academic year 2022-2023.
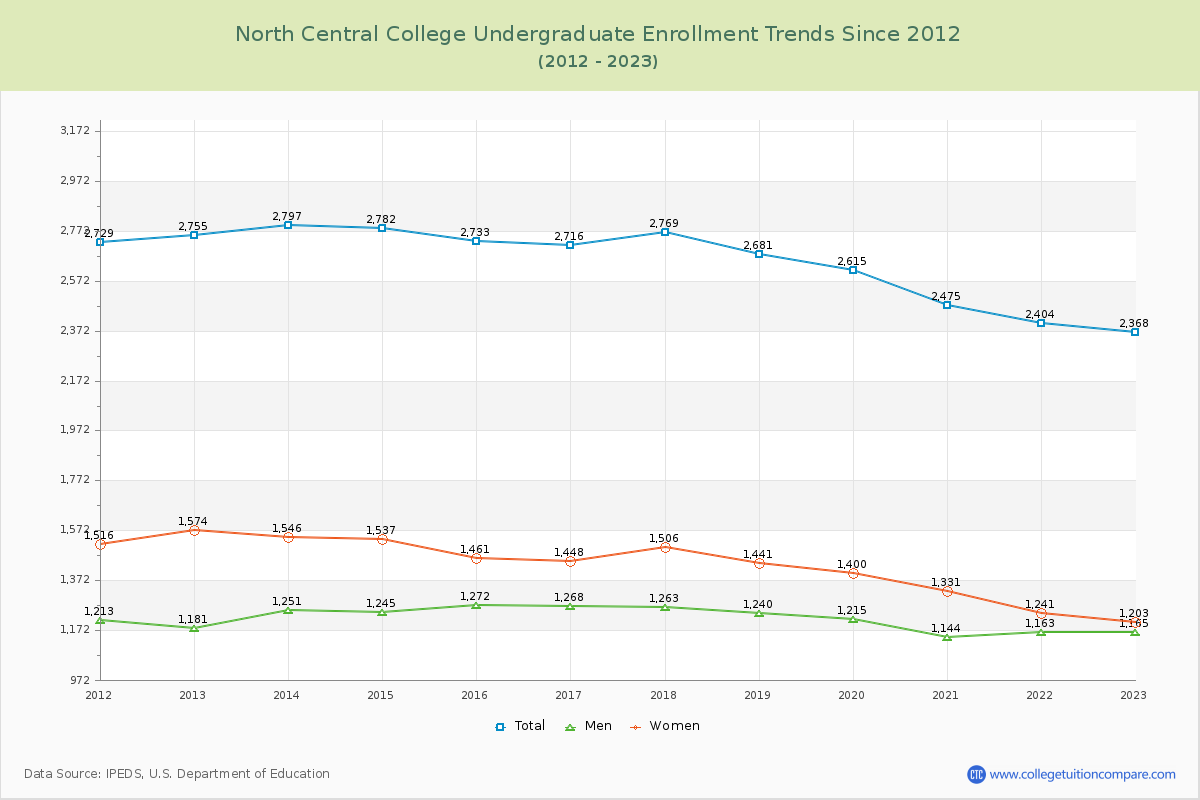
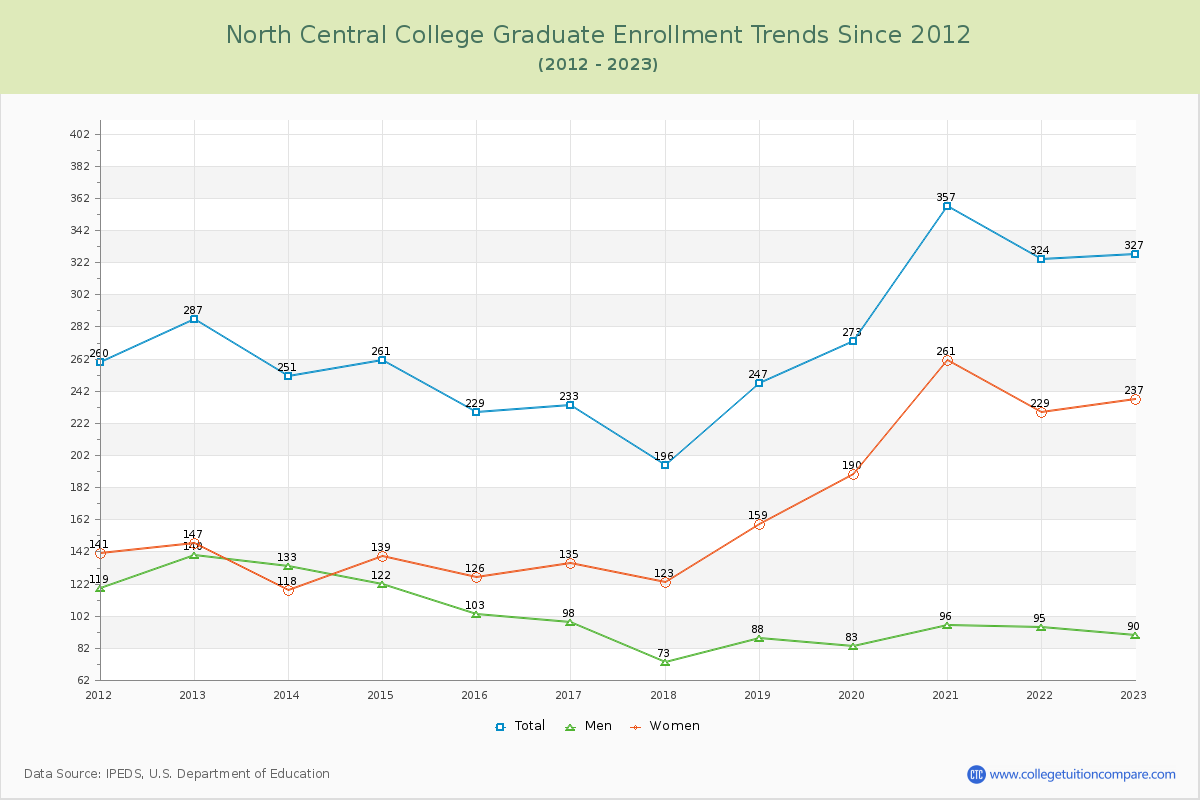
87.87% of total students is undergraduate students and 12.13% students is graduate students. The number of undergraduate students has decreased by 387 and the graduate enrollment has increased by 40 over past 10 years.
The female to male ratio is 1.15 to 1 and it means that there are slightly more female students enrolled in NCC than male students.
The following table and chart illustrate the changes in student population by gender at North Central College since 2012.
| Year | Total | Undergraduate | Graduate | ||||
|---|---|---|---|---|---|---|---|
| Total | Men | Women | Total | Men | Women | ||
| 2012-13 | 3,042 | 2,755 | 1,181 | 1,574 | 287 | 140 | 147 |
| 2013-14 | 3,048 6 | 2,797 42 | 1,251 70 | 1,546 -28 | 251 -36 | 133 -7 | 118 -29 |
| 2014-15 | 3,043 -5 | 2,782 -15 | 1,245 -6 | 1,537 -9 | 261 10 | 122 -11 | 139 21 |
| 2015-16 | 2,962 -81 | 2,733 -49 | 1,272 27 | 1,461 -76 | 229 -32 | 103 -19 | 126 -13 |
| 2016-17 | 2,949 -13 | 2,716 -17 | 1,268 -4 | 1,448 -13 | 233 4 | 98 -5 | 135 9 |
| 2017-18 | 2,965 16 | 2,769 53 | 1,263 -5 | 1,506 58 | 196 -37 | 73 -25 | 123 -12 |
| 2018-19 | 2,928 -37 | 2,681 -88 | 1,240 -23 | 1,441 -65 | 247 51 | 88 15 | 159 36 |
| 2019-20 | 2,888 -40 | 2,615 -66 | 1,215 -25 | 1,400 -41 | 273 26 | 83 -5 | 190 31 |
| 2020-21 | 2,832 -56 | 2,475 -140 | 1,144 -71 | 1,331 -69 | 357 84 | 96 13 | 261 71 |
| 2021-22 | 2,728 -104 | 2,404 -71 | 1,163 19 | 1,241 -90 | 324 -33 | 95 -1 | 229 -32 |
| 2022-23 | 2,695 -33 | 2,368 -36 | 1,165 2 | 1,203 -38 | 327 3 | 90 -5 | 237 8 |
| Average | 2,916 | 2,645 | 1,219 | 1,426 | 271 | 102 | 169 |