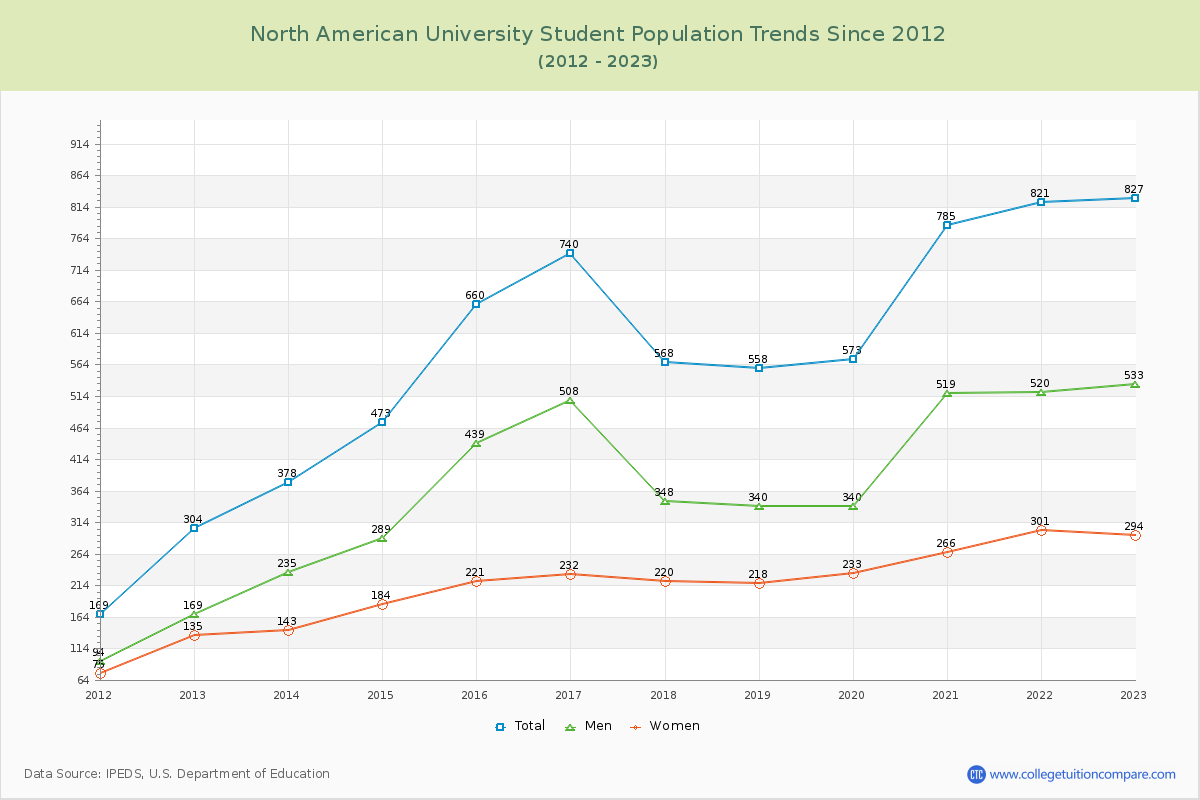
Student Population Changes
The average student population over the last 12 years is 608 where 827 students are attending the school for the academic year 2022-2023.
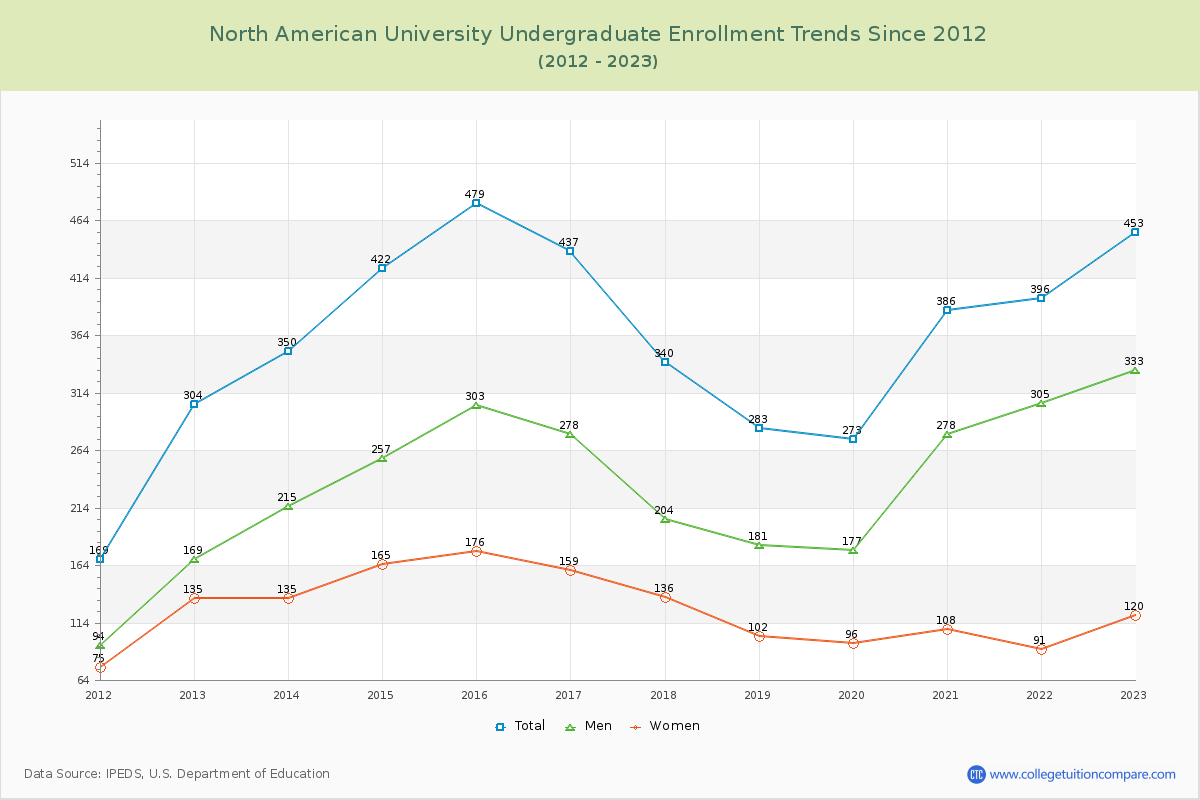
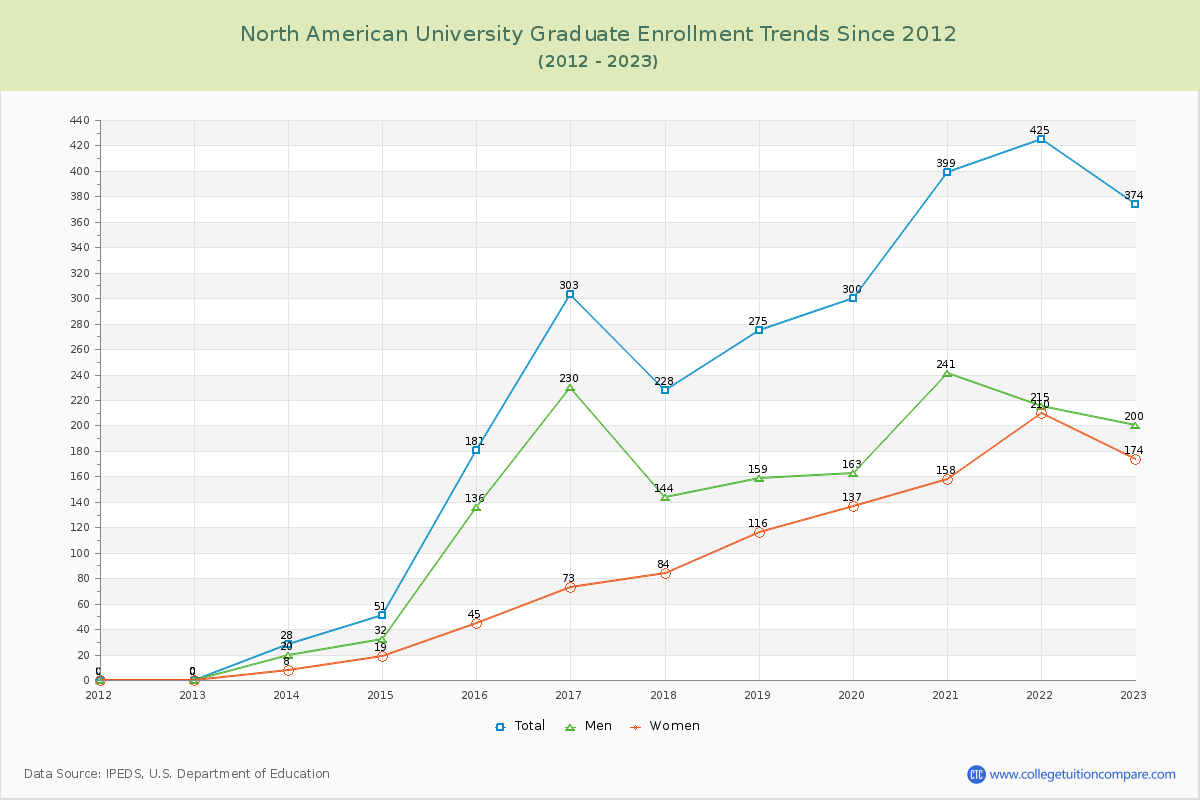
54.78% of total students is undergraduate students and 45.22% students is graduate students. The number of undergraduate students has increased by 149 and the graduate enrollment has increased by 374 over past 10 years.
The female to male ratio is 0.55 to 1 and it means that there are more male students enrolled in North American than female students.
The following table and chart illustrate the changes in student population by gender at North American University since 2012.
| Year | Total | Undergraduate | Graduate | ||||
|---|---|---|---|---|---|---|---|
| Total | Men | Women | Total | Men | Women | ||
| 2012-13 | 304 | 304 | 169 | 135 | 0 | 0 | 0 |
| 2013-14 | 378 74 | 350 46 | 215 46 | 135 0 | 28 28 | 20 20 | 8 8 |
| 2014-15 | 473 95 | 422 72 | 257 42 | 165 30 | 51 23 | 32 12 | 19 11 |
| 2015-16 | 660 187 | 479 57 | 303 46 | 176 11 | 181 130 | 136 104 | 45 26 |
| 2016-17 | 740 80 | 437 -42 | 278 -25 | 159 -17 | 303 122 | 230 94 | 73 28 |
| 2017-18 | 568 -172 | 340 -97 | 204 -74 | 136 -23 | 228 -75 | 144 -86 | 84 11 |
| 2018-19 | 558 -10 | 283 -57 | 181 -23 | 102 -34 | 275 47 | 159 15 | 116 32 |
| 2019-20 | 573 15 | 273 -10 | 177 -4 | 96 -6 | 300 25 | 163 4 | 137 21 |
| 2020-21 | 785 212 | 386 113 | 278 101 | 108 12 | 399 99 | 241 78 | 158 21 |
| 2021-22 | 821 36 | 396 10 | 305 27 | 91 -17 | 425 26 | 215 -26 | 210 52 |
| 2022-23 | 827 6 | 453 57 | 333 28 | 120 29 | 374 -51 | 200 -15 | 174 -36 |
| Average | 608 | 375 | 245 | 129 | 233 | 140 | 93 |