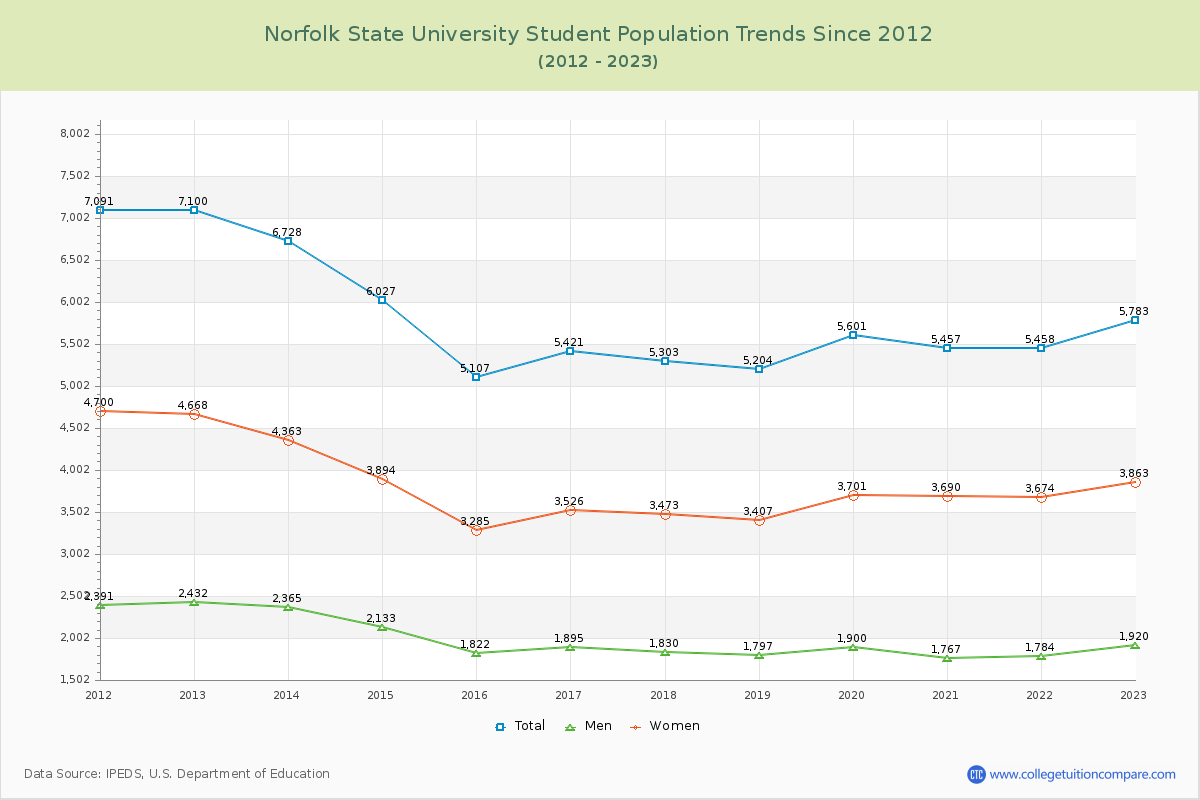
Student Population Changes
The average student population over the last 12 years is 5,744 where 5,783 students are attending the school for the academic year 2022-2023.
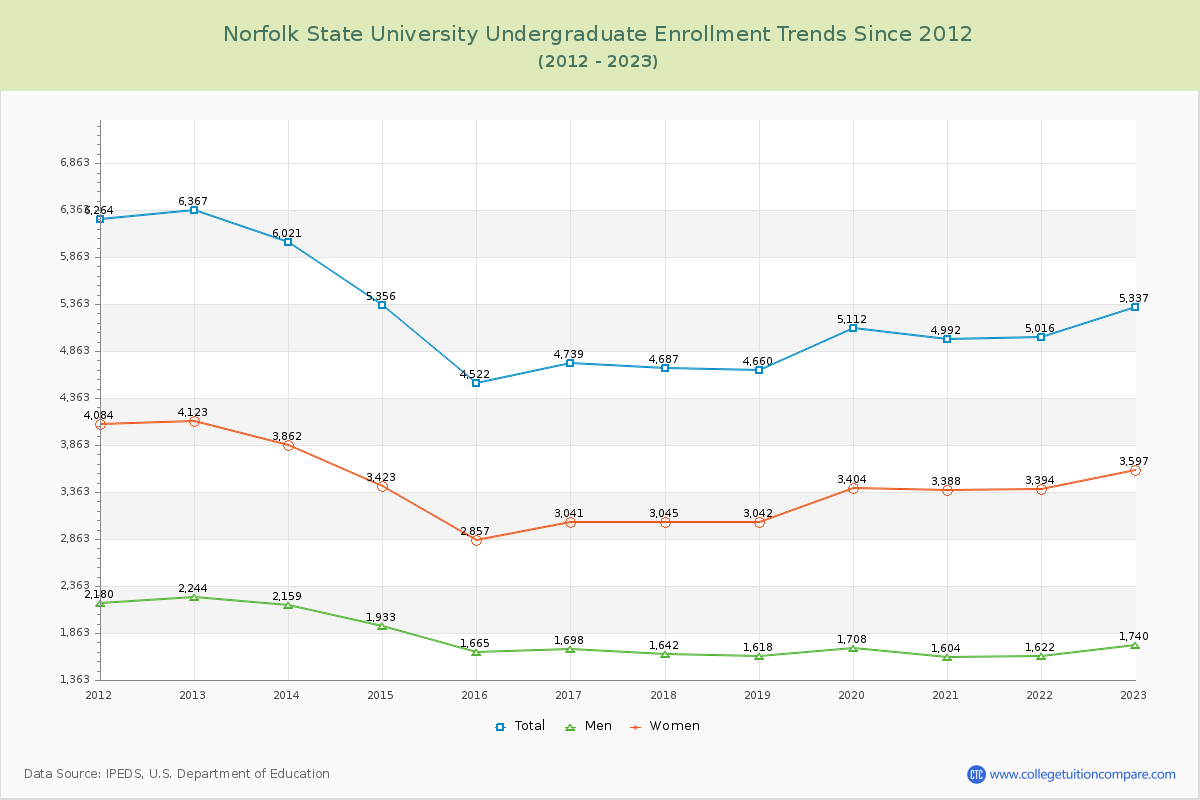
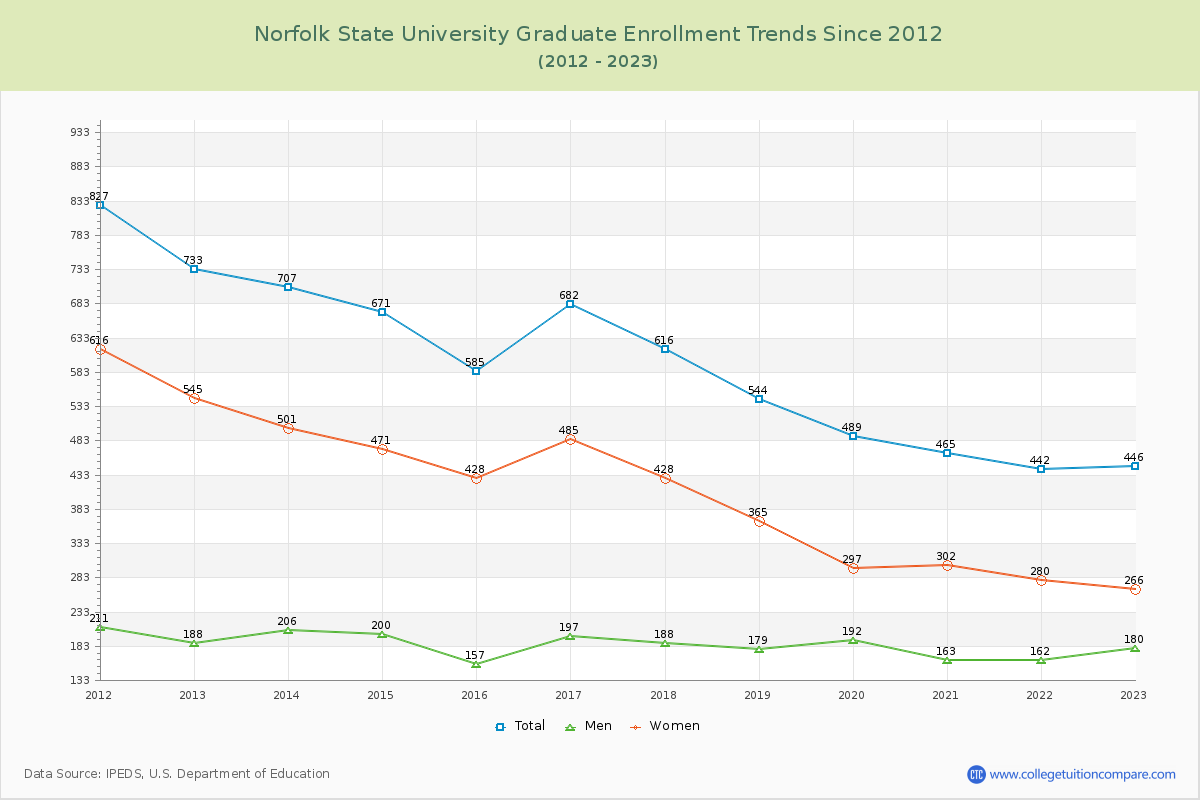
92.29% of total students is undergraduate students and 7.71% students is graduate students. The number of undergraduate students has decreased by 1,030 and the graduate enrollment has decreased by 287 over past 10 years.
The female to male ratio is 2.01 to 1 and it means that there are far more female students enrolled in NSU than male students.
The following table and chart illustrate the changes in student population by gender at Norfolk State University since 2012.
| Year | Total | Undergraduate | Graduate | ||||
|---|---|---|---|---|---|---|---|
| Total | Men | Women | Total | Men | Women | ||
| 2012-13 | 7,100 | 6,367 | 2,244 | 4,123 | 733 | 188 | 545 |
| 2013-14 | 6,728 -372 | 6,021 -346 | 2,159 -85 | 3,862 -261 | 707 -26 | 206 18 | 501 -44 |
| 2014-15 | 6,027 -701 | 5,356 -665 | 1,933 -226 | 3,423 -439 | 671 -36 | 200 -6 | 471 -30 |
| 2015-16 | 5,107 -920 | 4,522 -834 | 1,665 -268 | 2,857 -566 | 585 -86 | 157 -43 | 428 -43 |
| 2016-17 | 5,421 314 | 4,739 217 | 1,698 33 | 3,041 184 | 682 97 | 197 40 | 485 57 |
| 2017-18 | 5,303 -118 | 4,687 -52 | 1,642 -56 | 3,045 4 | 616 -66 | 188 -9 | 428 -57 |
| 2018-19 | 5,204 -99 | 4,660 -27 | 1,618 -24 | 3,042 -3 | 544 -72 | 179 -9 | 365 -63 |
| 2019-20 | 5,601 397 | 5,112 452 | 1,708 90 | 3,404 362 | 489 -55 | 192 13 | 297 -68 |
| 2020-21 | 5,457 -144 | 4,992 -120 | 1,604 -104 | 3,388 -16 | 465 -24 | 163 -29 | 302 5 |
| 2021-22 | 5,458 1 | 5,016 24 | 1,622 18 | 3,394 6 | 442 -23 | 162 -1 | 280 -22 |
| 2022-23 | 5,783 325 | 5,337 321 | 1,740 118 | 3,597 203 | 446 4 | 180 18 | 266 -14 |
| Average | 5,744 | 5,164 | 1,785 | 3,380 | 580 | 183 | 397 |