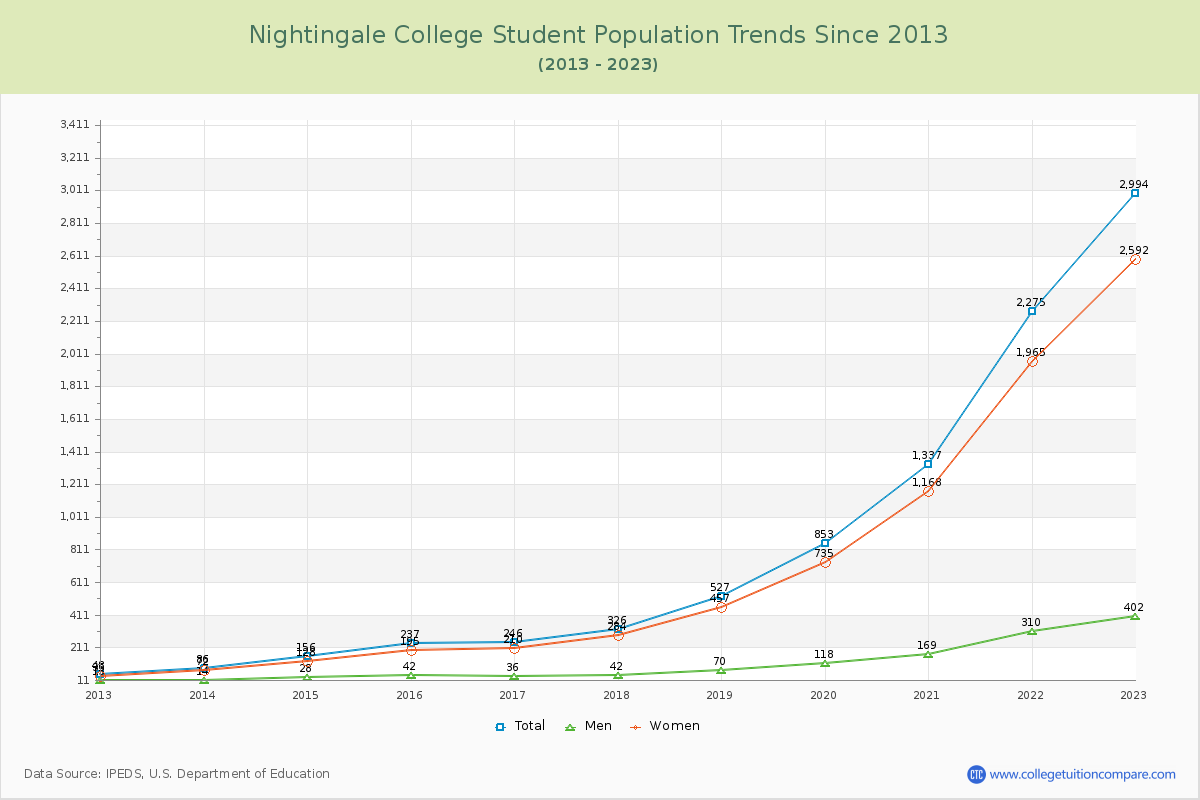
Student Population Changes
The average student population over the last 12 years is 826 where 2,994 students are attending the school for the academic year 2022-2023.
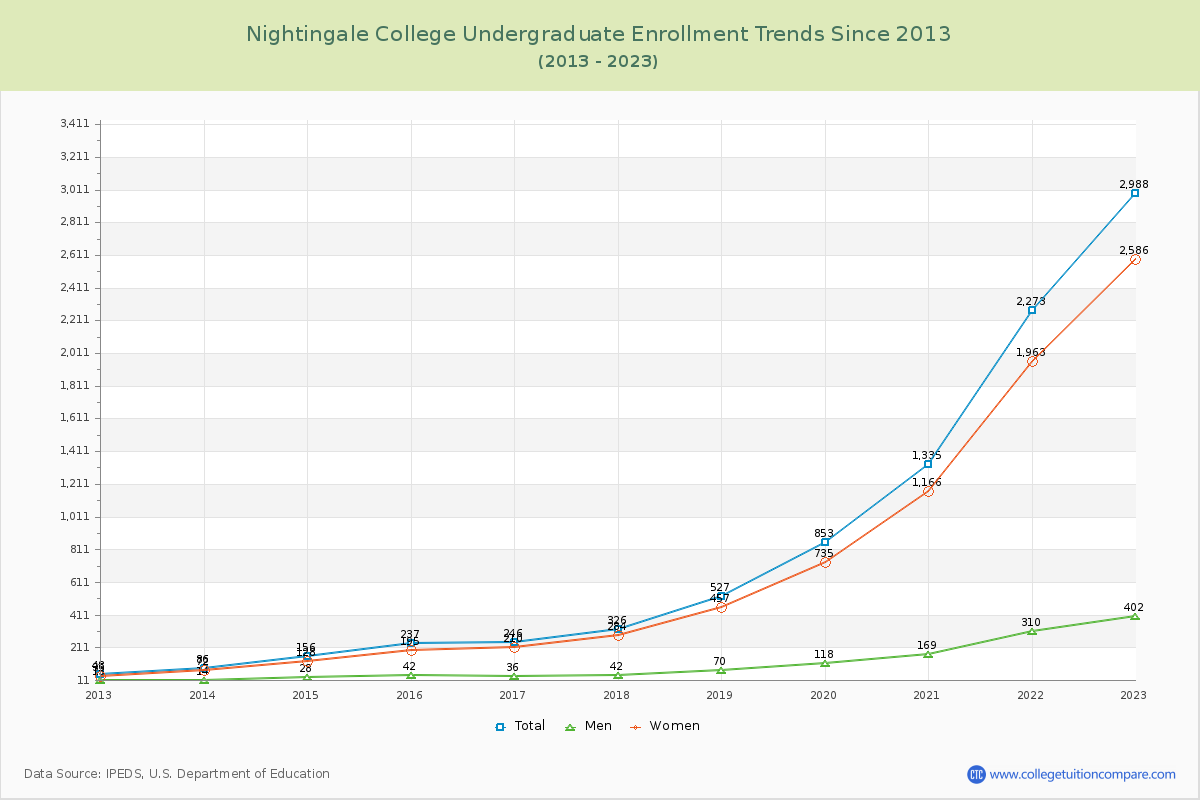
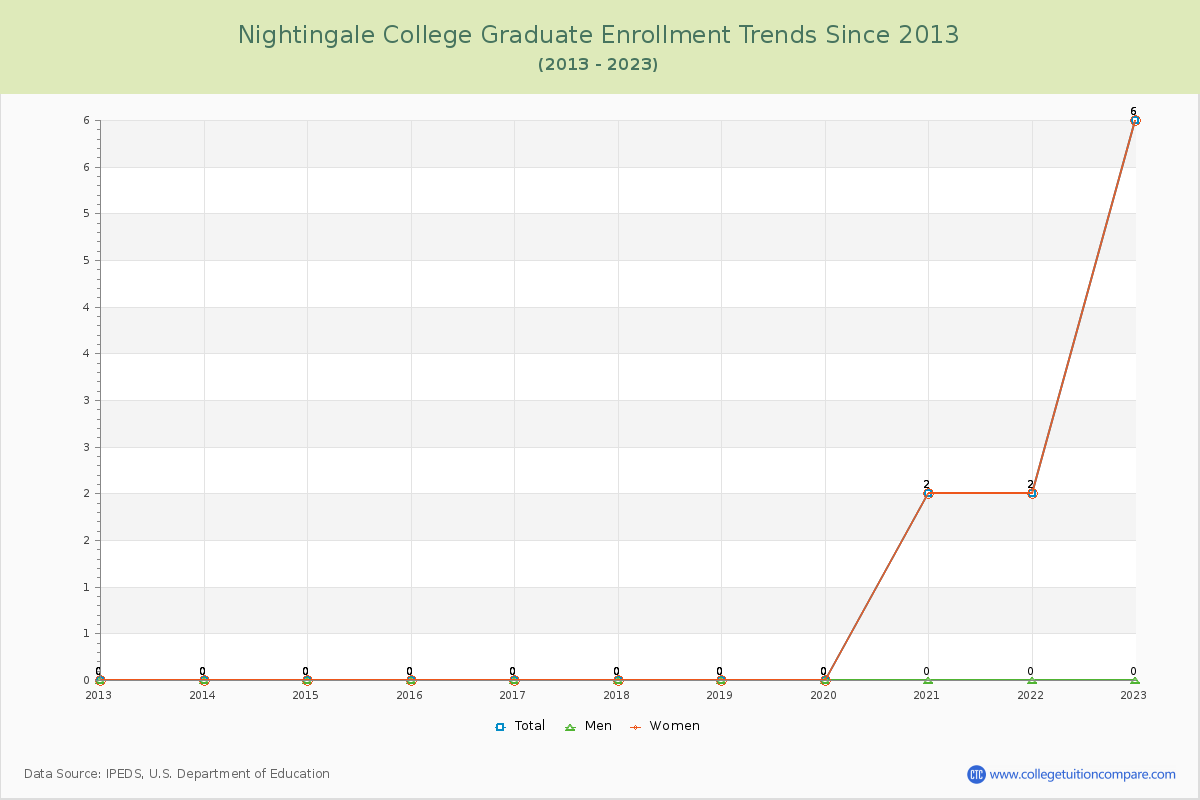
99.80% of total students is undergraduate students and 0.20% students is graduate students. The number of undergraduate students has increased by 2,940 and the graduate enrollment has increased by 6 over past 10 years.
The female to male ratio is 6.45 to 1 and it means that there are far more female students enrolled in Nightingale than male students.
The following table and chart illustrate the changes in student population by gender at Nightingale College since 2012.
| Year | Total | Undergraduate | Graduate | ||||
|---|---|---|---|---|---|---|---|
| Total | Men | Women | Total | Men | Women | ||
| 2012-13 | 48 | 48 | 13 | 35 | 0 | 0 | 0 |
| 2013-14 | 86 38 | 86 38 | 14 1 | 72 37 | 0 0 | 0 0 | 0 0 |
| 2014-15 | 156 70 | 156 70 | 28 14 | 128 56 | 0 0 | 0 0 | 0 0 |
| 2015-16 | 237 81 | 237 81 | 42 14 | 195 67 | 0 0 | 0 0 | 0 0 |
| 2016-17 | 246 9 | 246 9 | 36 -6 | 210 15 | 0 0 | 0 0 | 0 0 |
| 2017-18 | 326 80 | 326 80 | 42 6 | 284 74 | 0 0 | 0 0 | 0 0 |
| 2018-19 | 527 201 | 527 201 | 70 28 | 457 173 | 0 0 | 0 0 | 0 0 |
| 2019-20 | 853 326 | 853 326 | 118 48 | 735 278 | 0 0 | 0 0 | 0 0 |
| 2020-21 | 1,337 484 | 1,335 482 | 169 51 | 1,166 431 | 2 2 | 0 0 | 2 2 |
| 2021-22 | 2,275 938 | 2,273 938 | 310 141 | 1,963 797 | 2 0 | 0 0 | 2 0 |
| 2022-23 | 2,994 719 | 2,988 715 | 402 92 | 2,586 623 | 6 4 | 0 0 | 6 4 |
| Average | 826 | 825 | 113 | 712 | 1 | 0 | 1 |