Student Population Changes
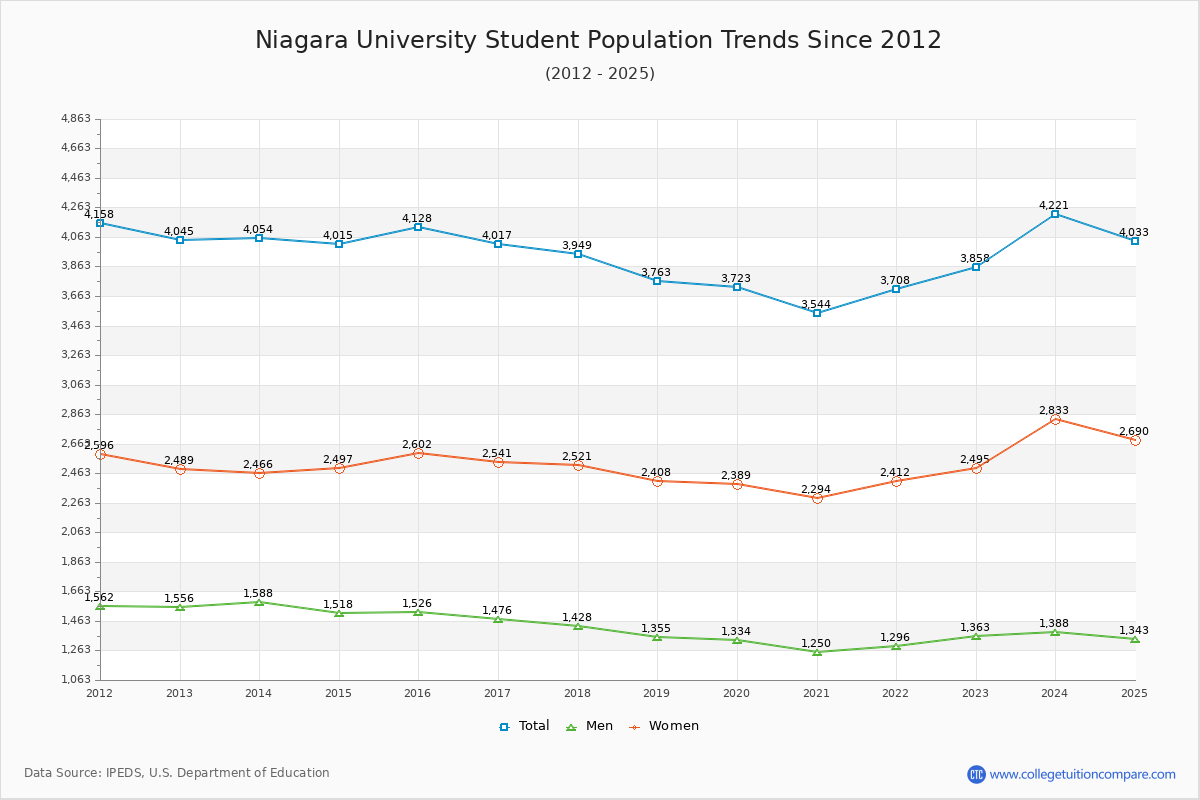
The average student population over the last 12 years is 3,891 where 3,858 students are attending the school for the academic year 2022-2023.
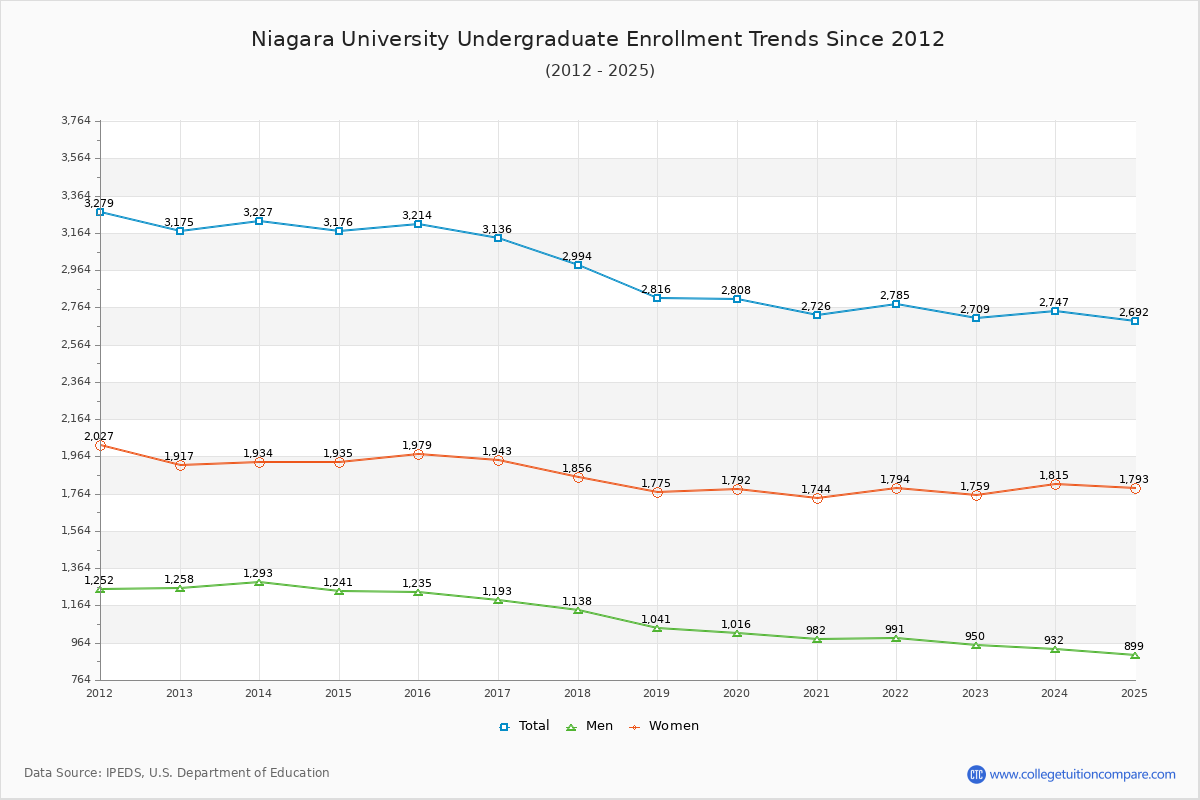
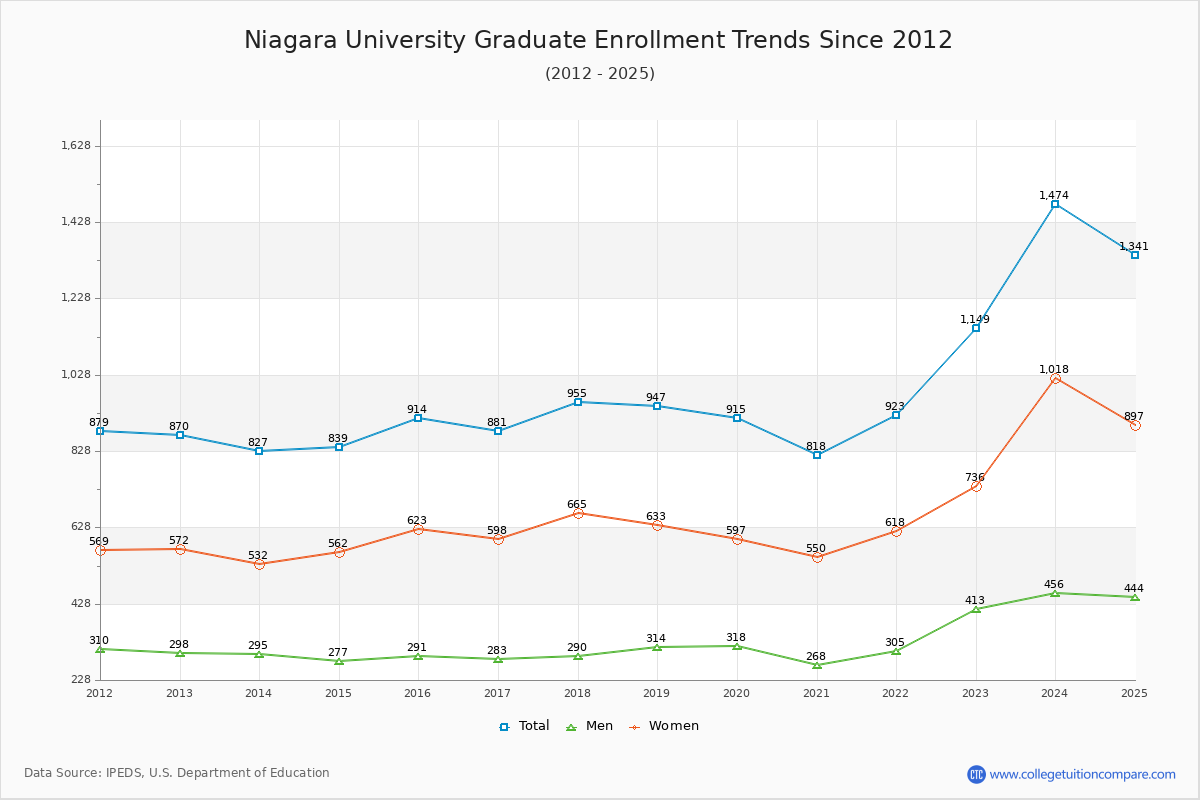
70.22% of total students is undergraduate students and 29.78% students is graduate students. The number of undergraduate students has decreased by 466 and the graduate enrollment has increased by 279 over past 10 years.
The female to male ratio is 1.83 to 1 and it means that there are more female students enrolled in Niagara than male students.
The following table and chart illustrate the changes in student population by gender at Niagara University since 2012.
| Year | Total | Undergraduate | Graduate | ||||
|---|---|---|---|---|---|---|---|
| Total | Men | Women | Total | Men | Women | ||
| 2012-13 | 4,045 | 3,175 | 1,258 | 1,917 | 870 | 298 | 572 |
| 2013-14 | 4,054 9 | 3,227 52 | 1,293 35 | 1,934 17 | 827 -43 | 295 -3 | 532 -40 |
| 2014-15 | 4,015 -39 | 3,176 -51 | 1,241 -52 | 1,935 1 | 839 12 | 277 -18 | 562 30 |
| 2015-16 | 4,128 113 | 3,214 38 | 1,235 -6 | 1,979 44 | 914 75 | 291 14 | 623 61 |
| 2016-17 | 4,017 -111 | 3,136 -78 | 1,193 -42 | 1,943 -36 | 881 -33 | 283 -8 | 598 -25 |
| 2017-18 | 3,949 -68 | 2,994 -142 | 1,138 -55 | 1,856 -87 | 955 74 | 290 7 | 665 67 |
| 2018-19 | 3,763 -186 | 2,816 -178 | 1,041 -97 | 1,775 -81 | 947 -8 | 314 24 | 633 -32 |
| 2019-20 | 3,723 -40 | 2,808 -8 | 1,016 -25 | 1,792 17 | 915 -32 | 318 4 | 597 -36 |
| 2020-21 | 3,544 -179 | 2,726 -82 | 982 -34 | 1,744 -48 | 818 -97 | 268 -50 | 550 -47 |
| 2021-22 | 3,708 164 | 2,785 59 | 991 9 | 1,794 50 | 923 105 | 305 37 | 618 68 |
| 2022-23 | 3,858 150 | 2,709 -76 | 950 -41 | 1,759 -35 | 1,149 226 | 413 108 | 736 118 |
| Average | 3,891 | 2,979 | 1,122 | 1,857 | 913 | 305 | 608 |