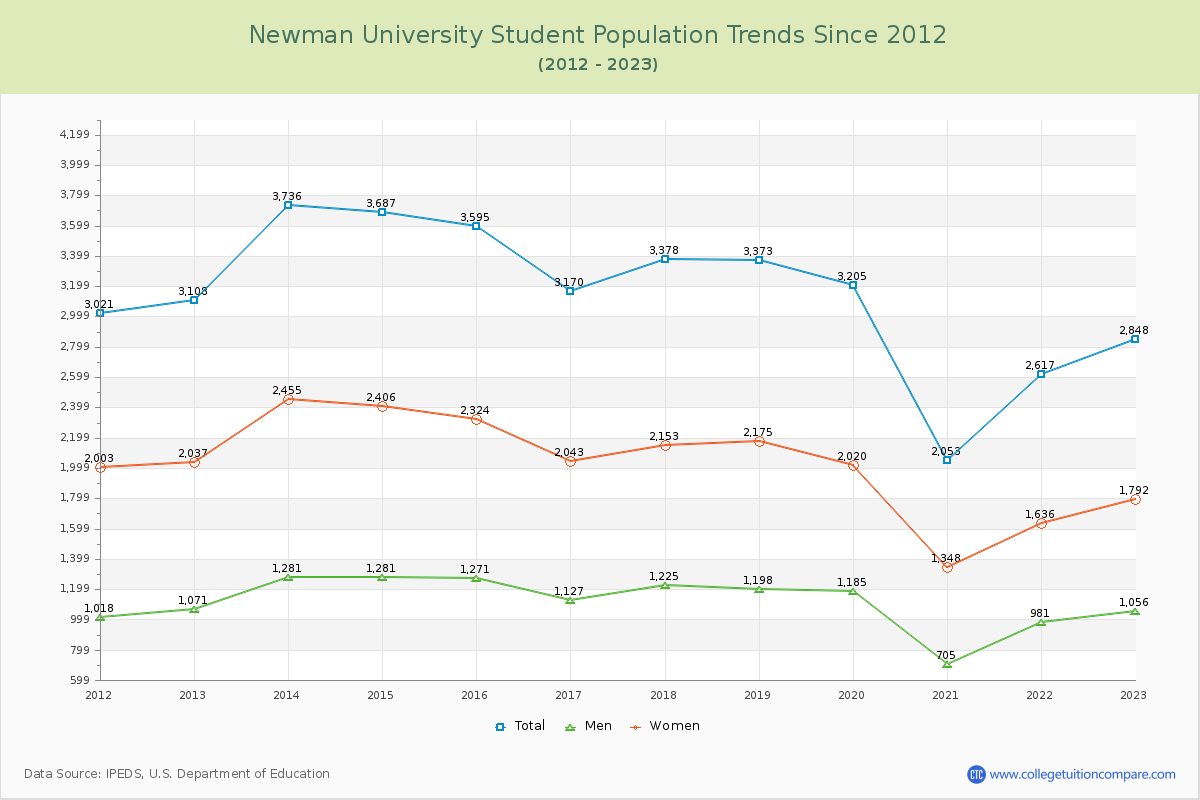
Student Population Changes
The average student population over the last 12 years is 3,161 where 2,848 students are attending the school for the academic year 2022-2023.
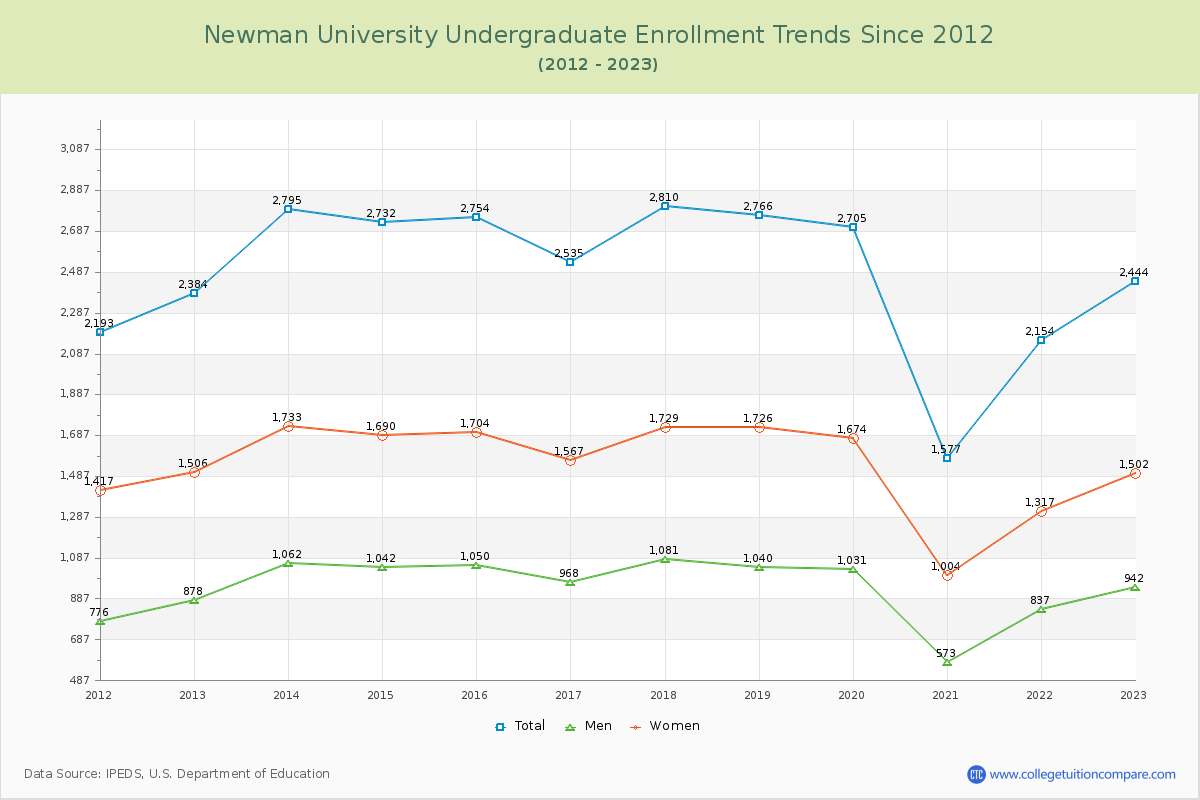
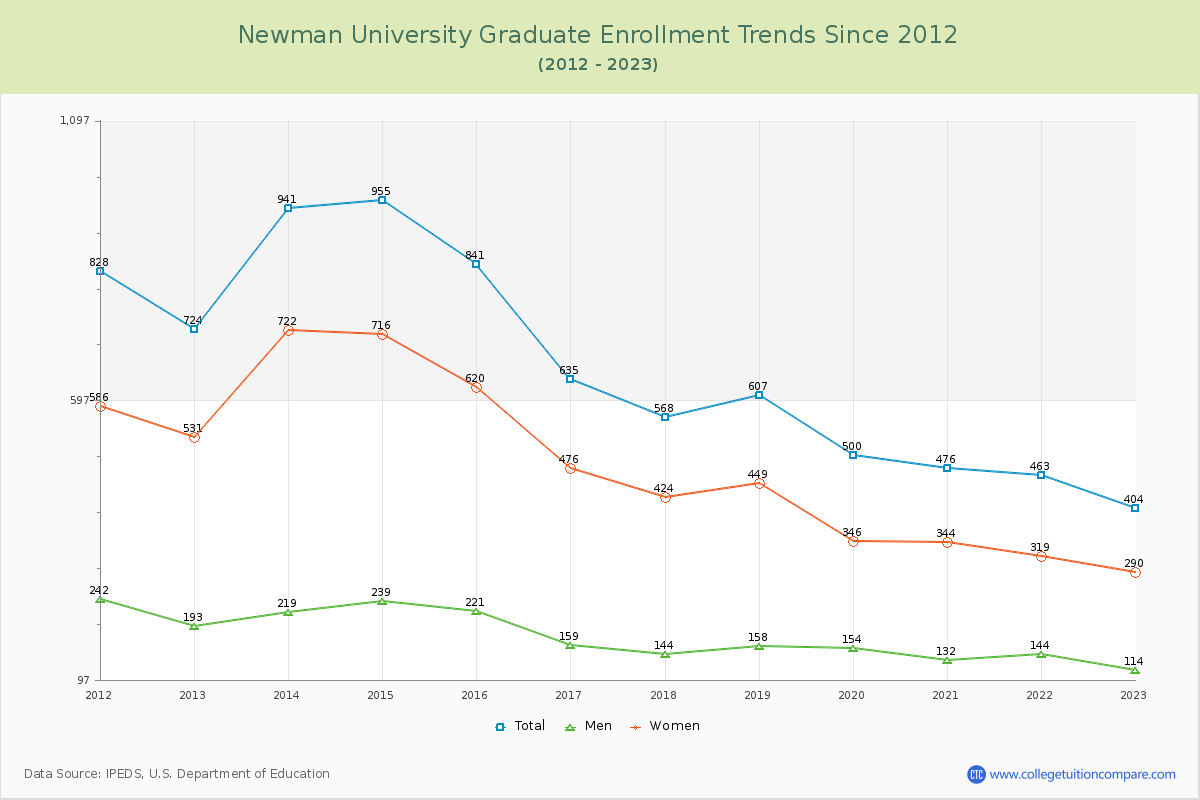
85.81% of total students is undergraduate students and 14.19% students is graduate students. The number of undergraduate students has increased by 60 and the graduate enrollment has decreased by 320 over past 10 years.
The female to male ratio is 1.70 to 1 and it means that there are more female students enrolled in Newman than male students.
The following table and chart illustrate the changes in student population by gender at Newman University since 2012.
| Year | Total | Undergraduate | Graduate | ||||
|---|---|---|---|---|---|---|---|
| Total | Men | Women | Total | Men | Women | ||
| 2012-13 | 3,108 | 2,384 | 878 | 1,506 | 724 | 193 | 531 |
| 2013-14 | 3,736 628 | 2,795 411 | 1,062 184 | 1,733 227 | 941 217 | 219 26 | 722 191 |
| 2014-15 | 3,687 -49 | 2,732 -63 | 1,042 -20 | 1,690 -43 | 955 14 | 239 20 | 716 -6 |
| 2015-16 | 3,595 -92 | 2,754 22 | 1,050 8 | 1,704 14 | 841 -114 | 221 -18 | 620 -96 |
| 2016-17 | 3,170 -425 | 2,535 -219 | 968 -82 | 1,567 -137 | 635 -206 | 159 -62 | 476 -144 |
| 2017-18 | 3,378 208 | 2,810 275 | 1,081 113 | 1,729 162 | 568 -67 | 144 -15 | 424 -52 |
| 2018-19 | 3,373 -5 | 2,766 -44 | 1,040 -41 | 1,726 -3 | 607 39 | 158 14 | 449 25 |
| 2019-20 | 3,205 -168 | 2,705 -61 | 1,031 -9 | 1,674 -52 | 500 -107 | 154 -4 | 346 -103 |
| 2020-21 | 2,053 -1,152 | 1,577 -1,128 | 573 -458 | 1,004 -670 | 476 -24 | 132 -22 | 344 -2 |
| 2021-22 | 2,617 564 | 2,154 577 | 837 264 | 1,317 313 | 463 -13 | 144 12 | 319 -25 |
| 2022-23 | 2,848 231 | 2,444 290 | 942 105 | 1,502 185 | 404 -59 | 114 -30 | 290 -29 |
| Average | 3,161 | 2,514 | 955 | 1,559 | 647 | 171 | 476 |