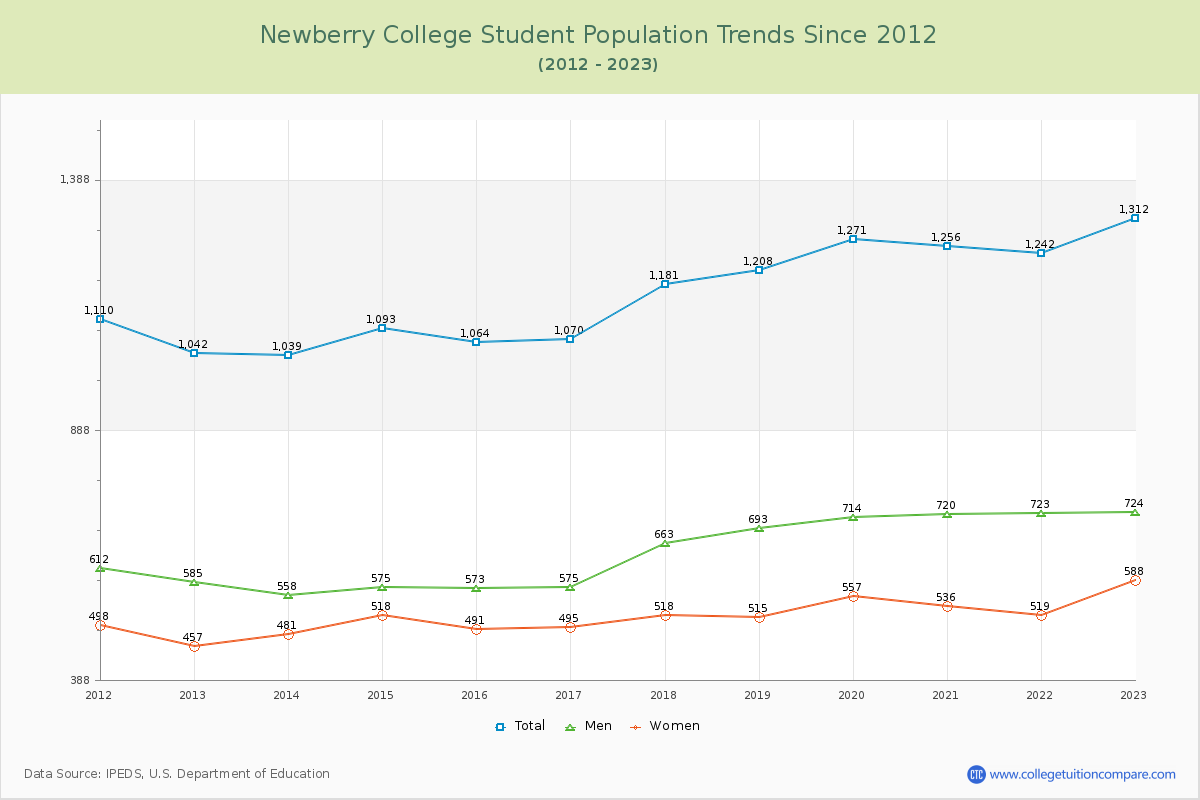
Student Population Changes
The average student population over the last 12 years is 1,162 where 1,312 students are attending the school for the academic year 2022-2023.
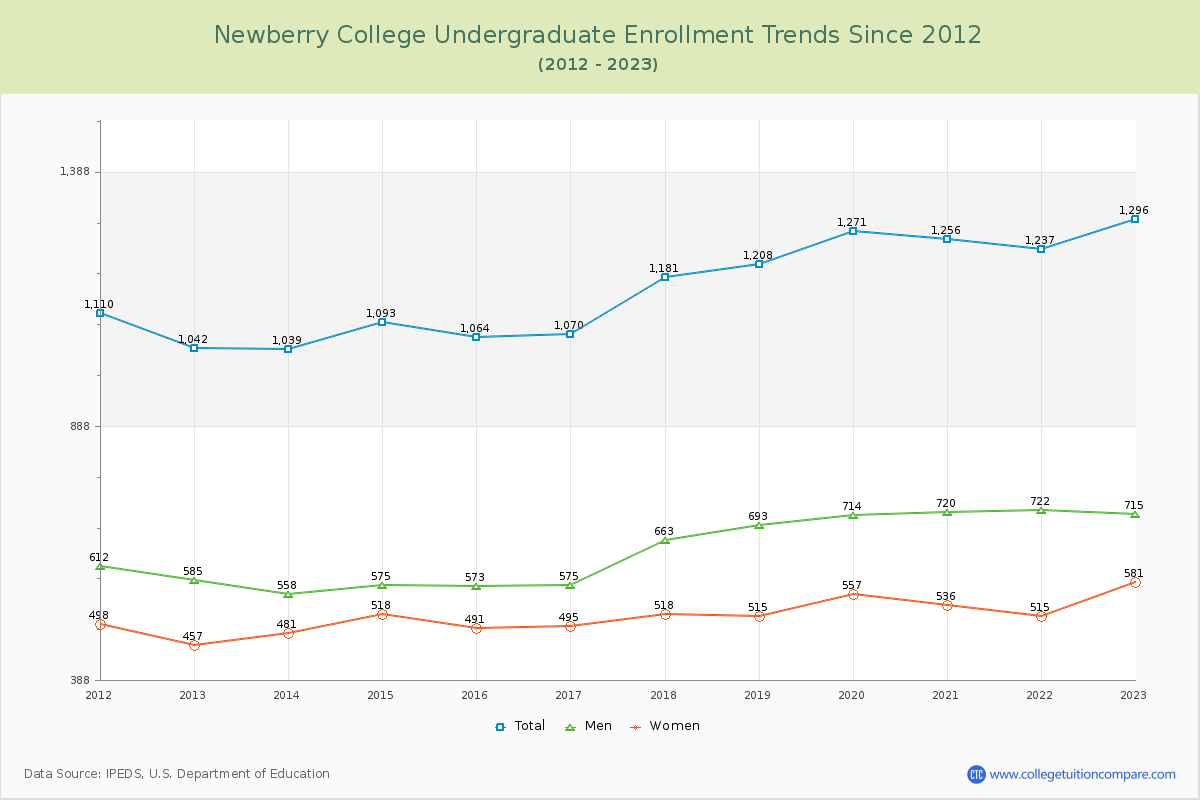
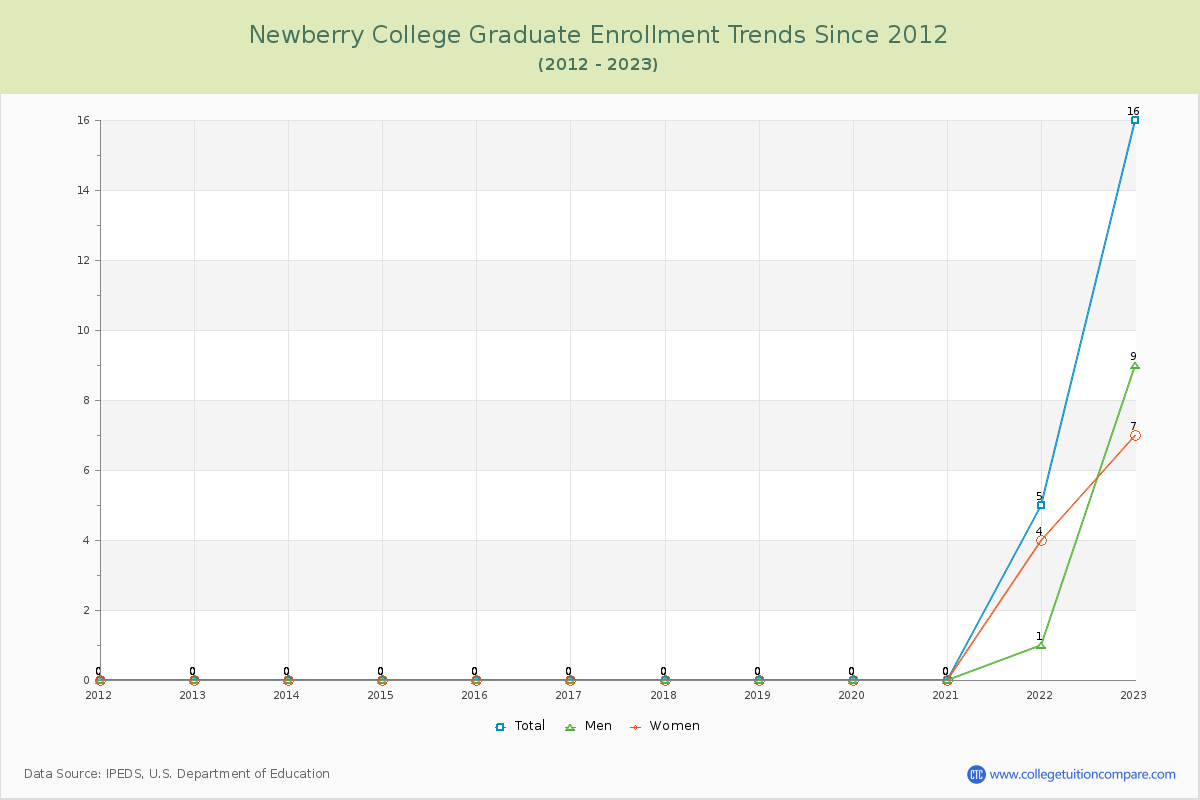
98.78% of total students is undergraduate students and 1.22% students is graduate students. The number of undergraduate students has increased by 254 and the graduate enrollment has increased by 16 over past 10 years.
The female to male ratio is 0.81 to 1 and it means that there are slightly more male students enrolled in Newberry than female students.
The following table and chart illustrate the changes in student population by gender at Newberry College since 2012.
| Year | Total | Undergraduate | Graduate | ||||
|---|---|---|---|---|---|---|---|
| Total | Men | Women | Total | Men | Women | ||
| 2012-13 | 1,042 | 1,042 | 585 | 457 | 0 | 0 | 0 |
| 2013-14 | 1,039 -3 | 1,039 -3 | 558 -27 | 481 24 | 0 0 | 0 0 | 0 0 |
| 2014-15 | 1,093 54 | 1,093 54 | 575 17 | 518 37 | 0 0 | 0 0 | 0 0 |
| 2015-16 | 1,064 -29 | 1,064 -29 | 573 -2 | 491 -27 | 0 0 | 0 0 | 0 0 |
| 2016-17 | 1,070 6 | 1,070 6 | 575 2 | 495 4 | 0 0 | 0 0 | 0 0 |
| 2017-18 | 1,181 111 | 1,181 111 | 663 88 | 518 23 | 0 0 | 0 0 | 0 0 |
| 2018-19 | 1,208 27 | 1,208 27 | 693 30 | 515 -3 | 0 0 | 0 0 | 0 0 |
| 2019-20 | 1,271 63 | 1,271 63 | 714 21 | 557 42 | 0 0 | 0 0 | 0 0 |
| 2020-21 | 1,256 -15 | 1,256 -15 | 720 6 | 536 -21 | 0 0 | 0 0 | 0 0 |
| 2021-22 | 1,242 -14 | 1,237 -19 | 722 2 | 515 -21 | 5 5 | 1 1 | 4 4 |
| 2022-23 | 1,312 70 | 1,296 59 | 715 -7 | 581 66 | 16 11 | 9 8 | 7 3 |
| Average | 1,162 | 1,160 | 645 | 515 | 2 | 1 | 1 |