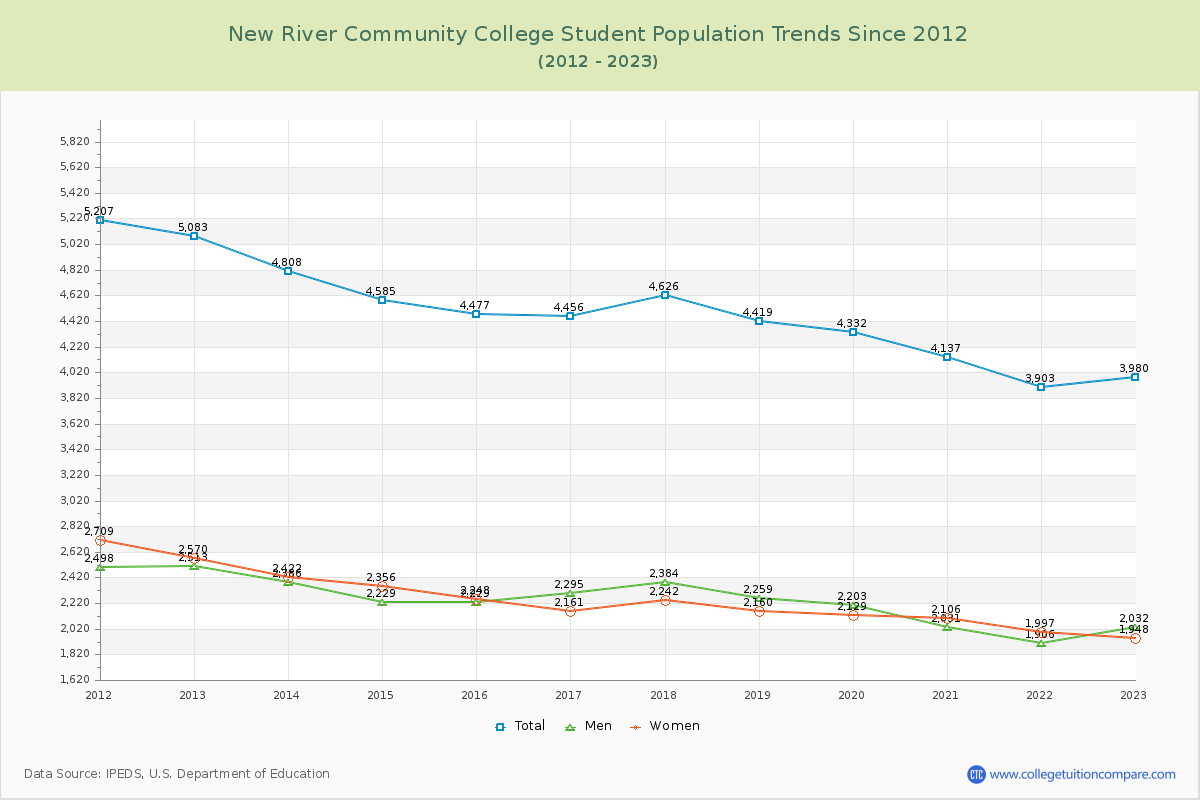
Student Population Changes
The average student population over the last 12 years is 4,437 where 3,980 students are attending the school for the academic year 2022-2023.
The female to male ratio is 0.96 to 1 and it means that there are similar numbers of female and male students enrolled in NRCC.
The following table and chart illustrate the changes in student population by gender at New River Community College since 2012.
| Year | Total | Men | Women |
|---|---|---|---|
| 2012-13 | 5,083 | 2,513 | 2,570 |
| 2013-14 | 4,808 -275 | 2,386 -127 | 2,422 -148 |
| 2014-15 | 4,585 -223 | 2,229 -157 | 2,356 -66 |
| 2015-16 | 4,477 -108 | 2,229 0 | 2,248 -108 |
| 2016-17 | 4,456 -21 | 2,295 66 | 2,161 -87 |
| 2017-18 | 4,626 170 | 2,384 89 | 2,242 81 |
| 2018-19 | 4,419 -207 | 2,259 -125 | 2,160 -82 |
| 2019-20 | 4,332 -87 | 2,203 -56 | 2,129 -31 |
| 2020-21 | 4,137 -195 | 2,031 -172 | 2,106 -23 |
| 2021-22 | 3,903 -234 | 1,906 -125 | 1,997 -109 |
| 2022-23 | 3,980 77 | 2,032 126 | 1,948 -49 |
| Average | 4,437 | 2,224 | 2,213 |