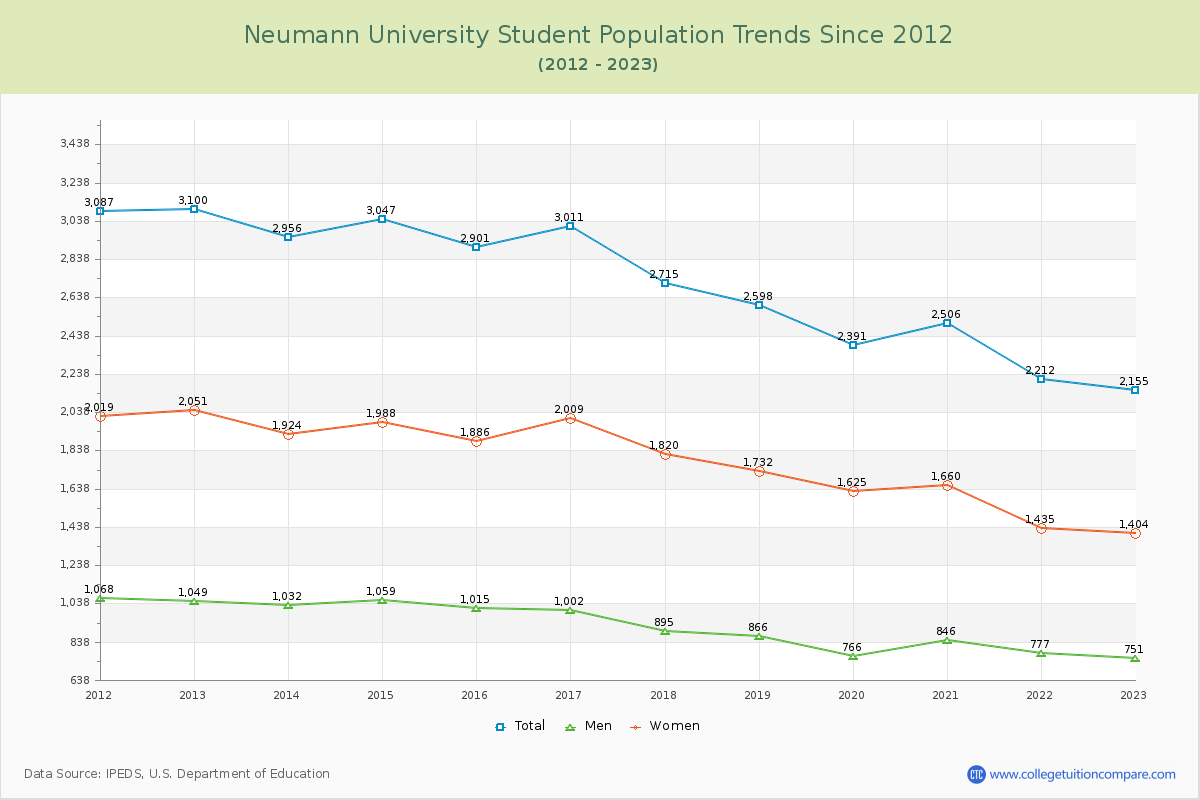
Student Population Changes
The average student population over the last 12 years is 2,690 where 2,155 students are attending the school for the academic year 2022-2023.
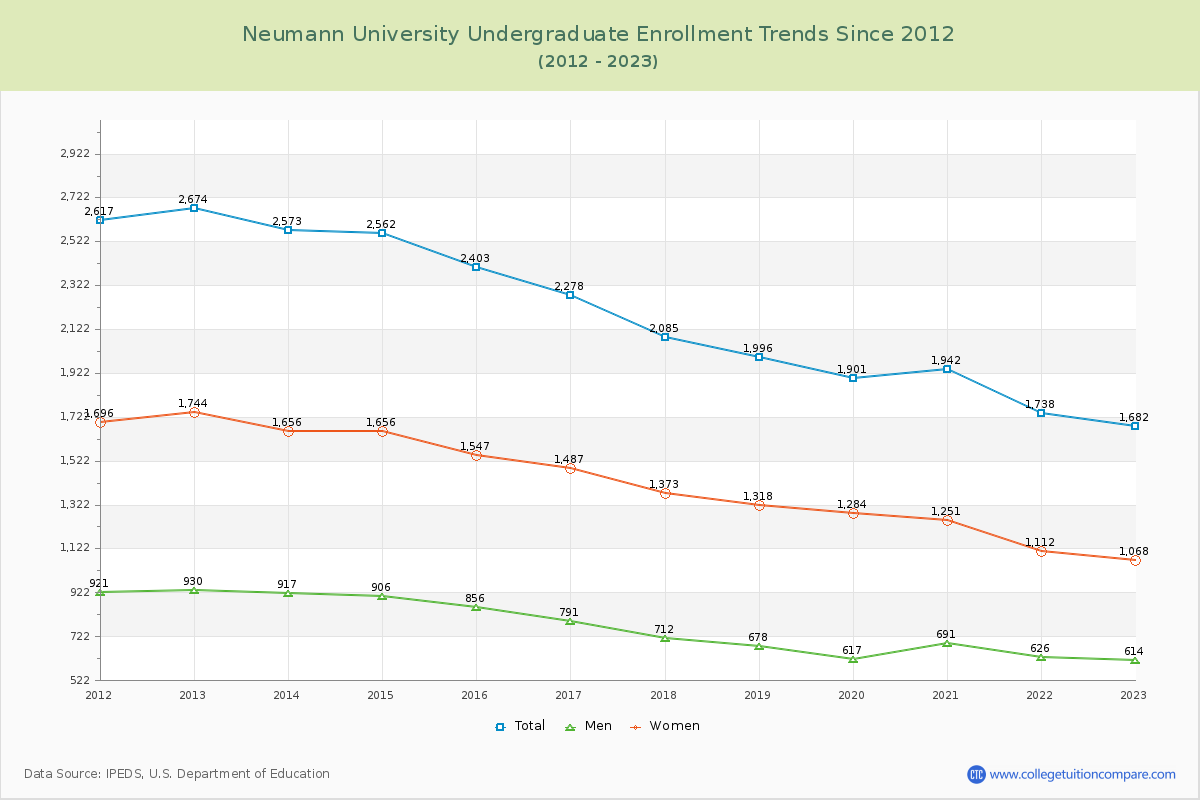
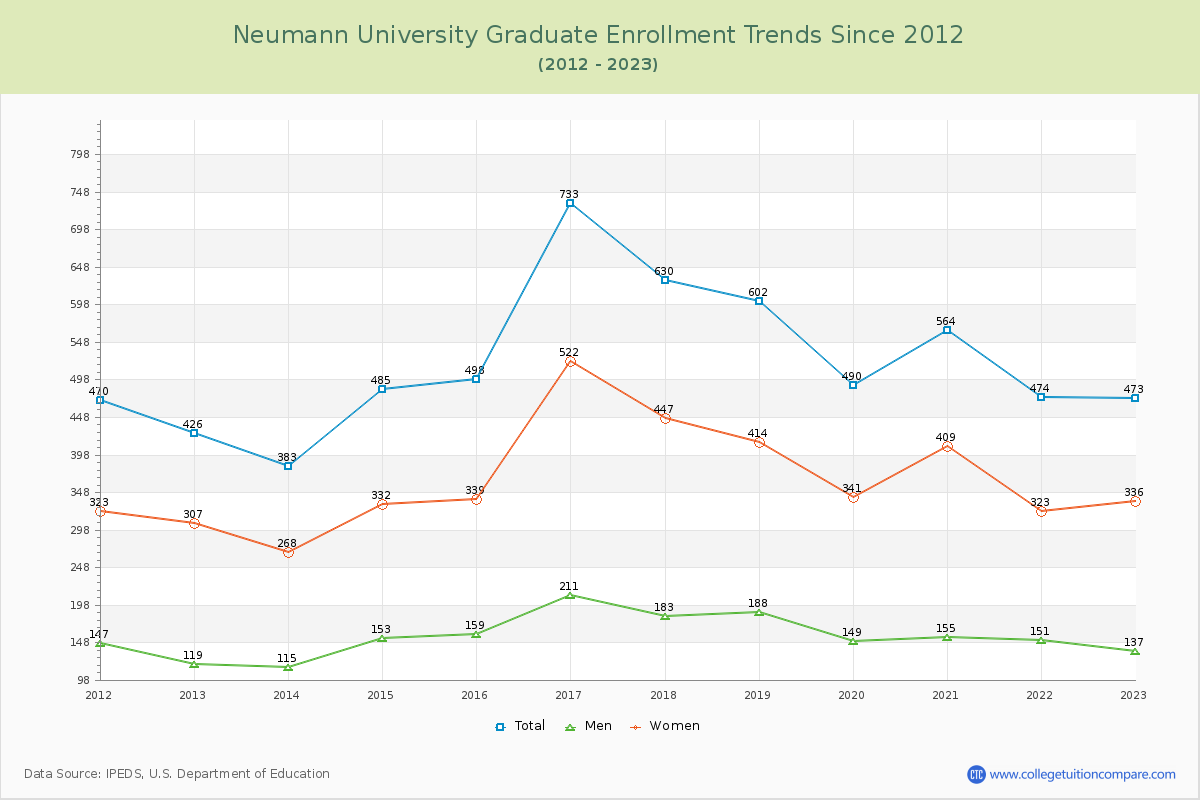
78.05% of total students is undergraduate students and 21.95% students is graduate students. The number of undergraduate students has decreased by 992 and the graduate enrollment has increased by 47 over past 10 years.
The female to male ratio is 1.87 to 1 and it means that there are more female students enrolled in Neumann than male students.
The following table and chart illustrate the changes in student population by gender at Neumann University since 2012.
| Year | Total | Undergraduate | Graduate | ||||
|---|---|---|---|---|---|---|---|
| Total | Men | Women | Total | Men | Women | ||
| 2012-13 | 3,100 | 2,674 | 930 | 1,744 | 426 | 119 | 307 |
| 2013-14 | 2,956 -144 | 2,573 -101 | 917 -13 | 1,656 -88 | 383 -43 | 115 -4 | 268 -39 |
| 2014-15 | 3,047 91 | 2,562 -11 | 906 -11 | 1,656 0 | 485 102 | 153 38 | 332 64 |
| 2015-16 | 2,901 -146 | 2,403 -159 | 856 -50 | 1,547 -109 | 498 13 | 159 6 | 339 7 |
| 2016-17 | 3,011 110 | 2,278 -125 | 791 -65 | 1,487 -60 | 733 235 | 211 52 | 522 183 |
| 2017-18 | 2,715 -296 | 2,085 -193 | 712 -79 | 1,373 -114 | 630 -103 | 183 -28 | 447 -75 |
| 2018-19 | 2,598 -117 | 1,996 -89 | 678 -34 | 1,318 -55 | 602 -28 | 188 5 | 414 -33 |
| 2019-20 | 2,391 -207 | 1,901 -95 | 617 -61 | 1,284 -34 | 490 -112 | 149 -39 | 341 -73 |
| 2020-21 | 2,506 115 | 1,942 41 | 691 74 | 1,251 -33 | 564 74 | 155 6 | 409 68 |
| 2021-22 | 2,212 -294 | 1,738 -204 | 626 -65 | 1,112 -139 | 474 -90 | 151 -4 | 323 -86 |
| 2022-23 | 2,155 -57 | 1,682 -56 | 614 -12 | 1,068 -44 | 473 -1 | 137 -14 | 336 13 |
| Average | 2,690 | 2,167 | 758 | 1,409 | 523 | 156 | 367 |