Enrollment Trends at NICC

462

Total Enrollment

184

Men

278

Women

The student population at Nebraska Indian Community College is 620 (all undergraduate). The number of students has increased by 462 over the past decade.

The female to male ratio is 1.70 to 1 which means that female students enrolled more than male students.

362 students enrolled in online degree program exclusively and the number of online students has decreased by -95.28% since 2015.

Student Population Changes

The average student population over the last 11 years is 328 where 620 students are attending the school for the academic year 2024-2025.

The female to male ratio is 1.70 to 1 and it means that there are more female students enrolled in NICC than male students.

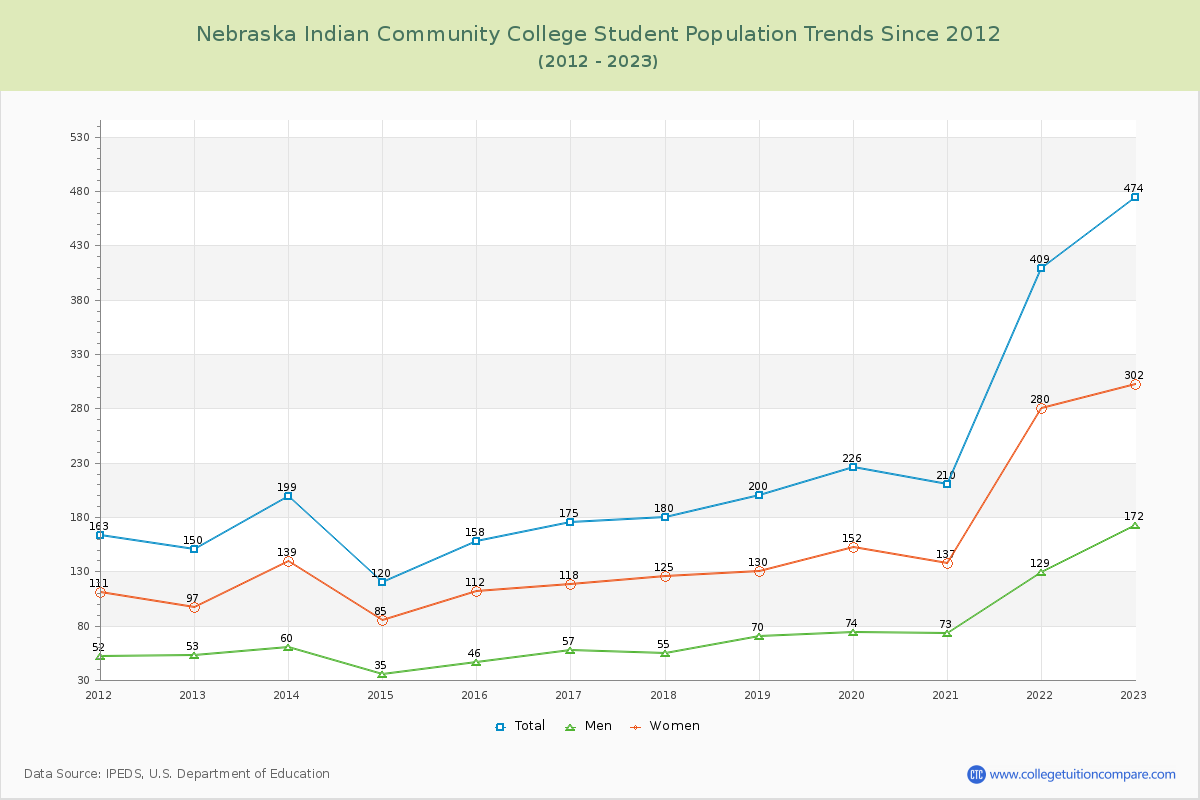
The following table and chart illustrate the changes in student population by gender at Nebraska Indian Community College since 2015.

YearTotalMenWomen
2015-1615846112
2016-17175
17
57
11
118
6
2017-18180
5
55
-2
125
7
2018-19200
20
70
15
130
5
2019-20226
26
74
4
152
22
2020-21210
-16
73
-1
137
-15
2021-22409
199
129
56
280
143
2022-23474
65
172
43
302
22
2023-24624
150
211
39
413
111
2024-25620
-4
230
19
390
-23
Average328112216
Nebraska Indian Community College Enrollment Trends Chart

Enrollment by Race/Ethnicity Changes

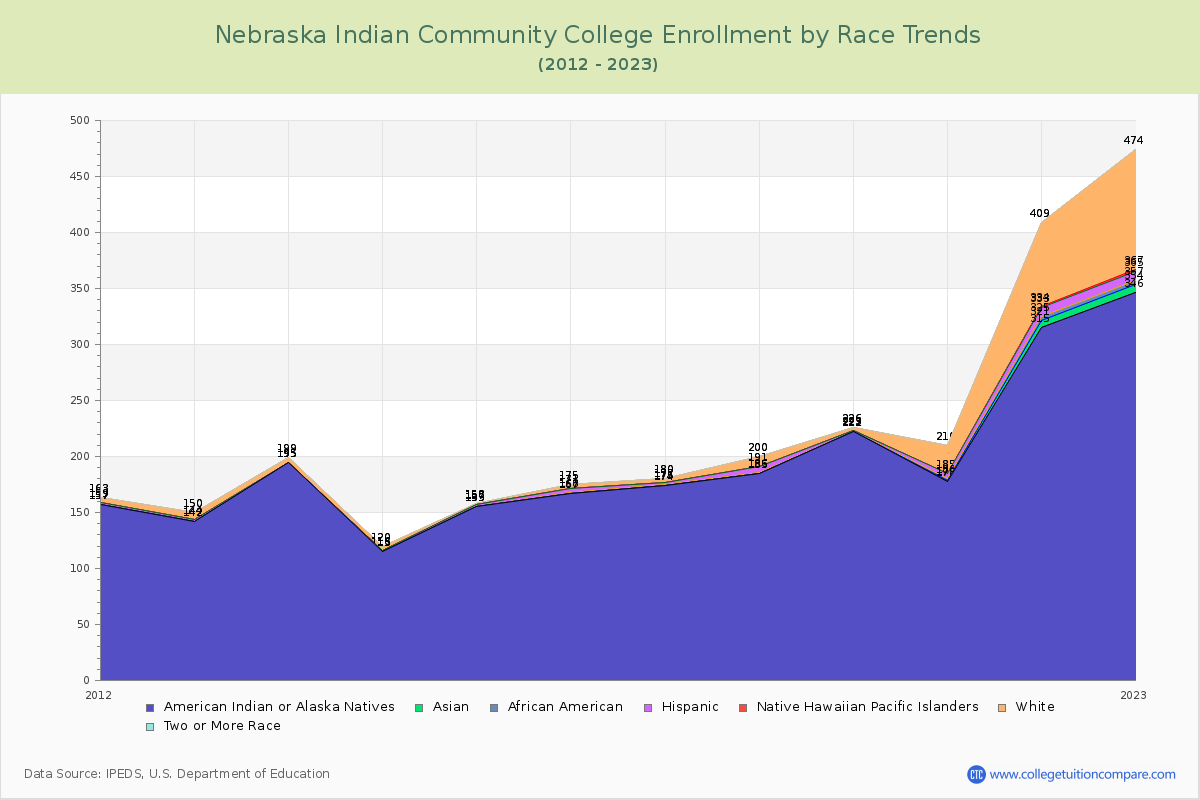
The percentage of white students is 17.58% and the percentage of black students is 0.65% at Nebraska Indian Community College. 0.65% of enrolled students is Asian. Hispanic students comprise 3.23% of the student body.

Over the past 10 years, the racial composition has shifted. The percentage of white students increased from 0.63% to 17.58%. Asian enrollment grew from 0.00% to 0.65%. Black student enrollment increased from 0.00% to 0.65%. Hispanic student representation expanded from 1.27% to 3.23%.

The overall racial diversity, measured by the Census Bureau Diversity Index, is 0.3661 which indicates that somewhat diverse. This increased from 0.0374 a decade ago, suggesting that racial diversity has improved.

The following table and chart illustrate the student population trends by race/ethnicity at Nebraska Indian Community College over the past 11 years (2015-2025).

YearAmerican Indian or Native AmericanAsianBlackHispanicNative Hawaiian or Other Pacific IslanderWhiteTwo or More Races
2015-16155002010
2016-17167013040
2017-18174012030
2018-19185015090
2019-20222001030
2020-211781150250
2021-223156481750
2022-2334683821070
2023-24483631811130
2024-25481442021090
Average2713271450
Nebraska Indian Community College Enrollment by Race Trends Chart

Distance Learning (Online Courses) Enrollment Changes

362 students are enrolled in online degree programs exclusively for the academic year 2024-2025, which is 59% of total students. The number of online students has decreased -95.28% since 2015. The following table and chart illustrate the changes in the online student population by enrolled type at Nebraska Indian Community College from 2015 to 2025.

YearTotal EnrollmentOnline CompletelyEnrolled in Some Online CoursesNot Enrolled in Online Courses
2015-16158012731
2016-17175013441
2017-18180013446
2018-192002612153
2019-202269416116
2020-21210139368
2021-2240926712814
2022-2347423554185
2023-246243682254
2024-256203626252
Average32814973106

Ratings & Review

Share your experiences and thoughts about Nebraska Indian Community College. It will be a great help to applicants and prospective students!