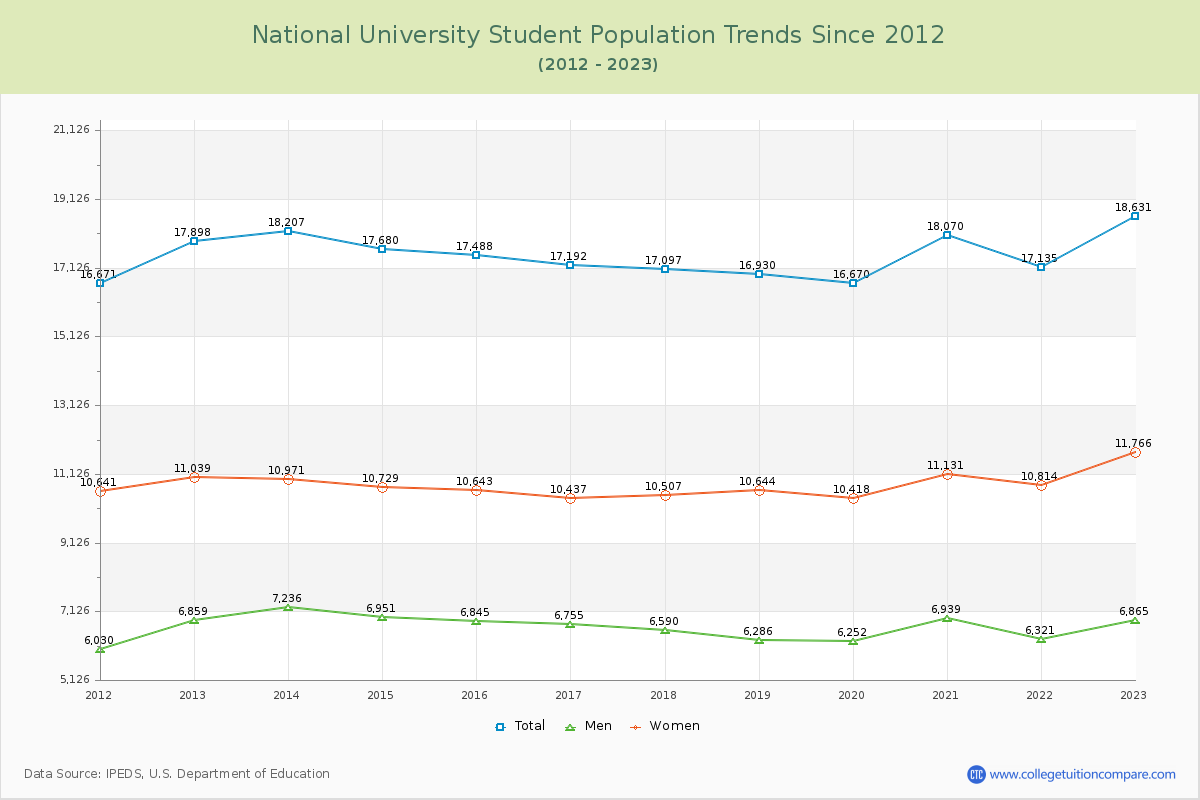
Student Population Changes
The average student population over the last 12 years is 17,545 where 18,631 students are attending the school for the academic year 2022-2023.
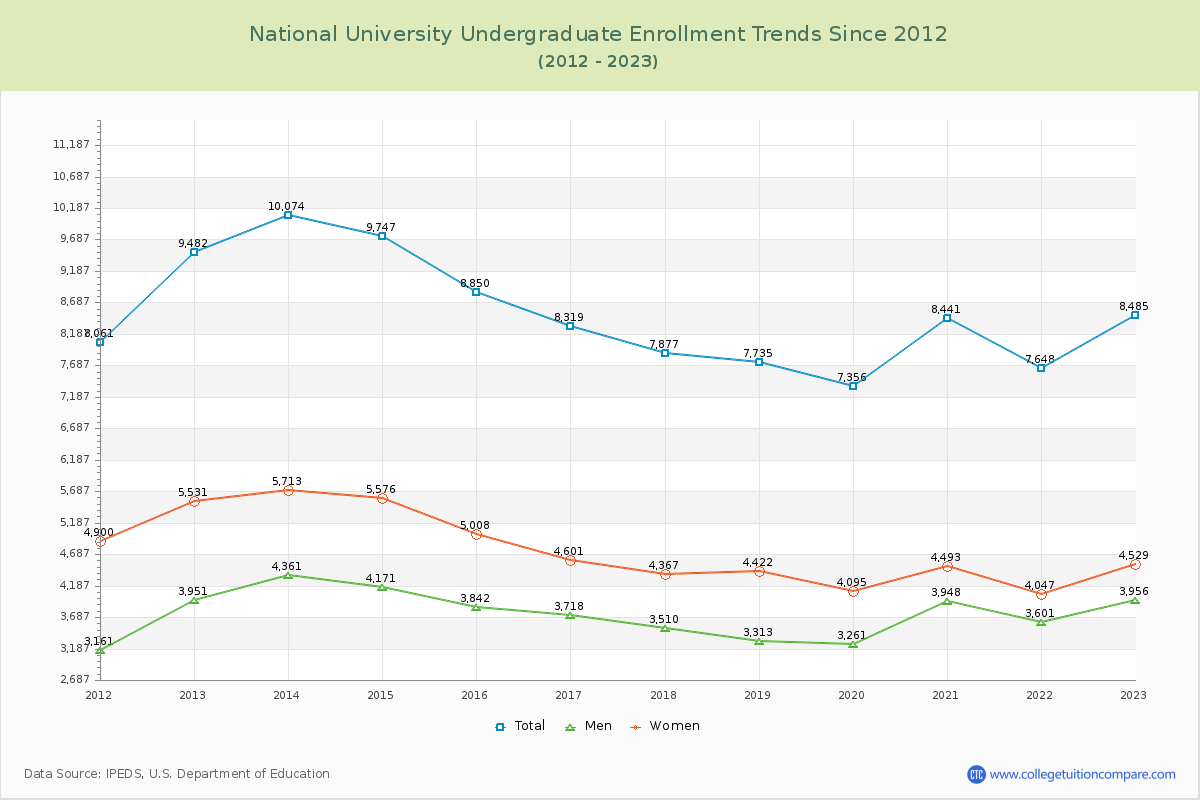
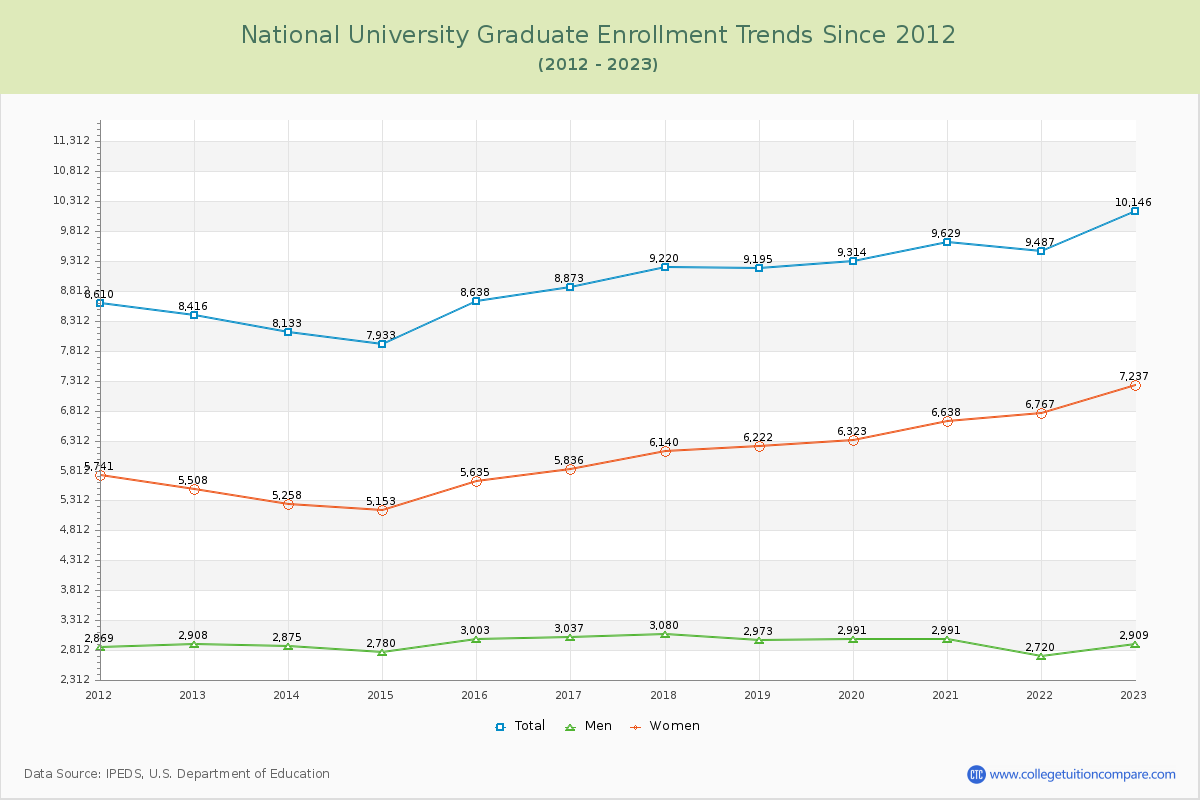
45.54% of total students is undergraduate students and 54.46% students is graduate students. The number of undergraduate students has decreased by 997 and the graduate enrollment has increased by 1,730 over past 10 years.
The female to male ratio is 1.71 to 1 and it means that there are more female students enrolled in National than male students.
The following table and chart illustrate the changes in student population by gender at National University since 2012.
| Year | Total | Undergraduate | Graduate | ||||
|---|---|---|---|---|---|---|---|
| Total | Men | Women | Total | Men | Women | ||
| 2012-13 | 17,898 | 9,482 | 3,951 | 5,531 | 8,416 | 2,908 | 5,508 |
| 2013-14 | 18,207 309 | 10,074 592 | 4,361 410 | 5,713 182 | 8,133 -283 | 2,875 -33 | 5,258 -250 |
| 2014-15 | 17,680 -527 | 9,747 -327 | 4,171 -190 | 5,576 -137 | 7,933 -200 | 2,780 -95 | 5,153 -105 |
| 2015-16 | 17,488 -192 | 8,850 -897 | 3,842 -329 | 5,008 -568 | 8,638 705 | 3,003 223 | 5,635 482 |
| 2016-17 | 17,192 -296 | 8,319 -531 | 3,718 -124 | 4,601 -407 | 8,873 235 | 3,037 34 | 5,836 201 |
| 2017-18 | 17,097 -95 | 7,877 -442 | 3,510 -208 | 4,367 -234 | 9,220 347 | 3,080 43 | 6,140 304 |
| 2018-19 | 16,930 -167 | 7,735 -142 | 3,313 -197 | 4,422 55 | 9,195 -25 | 2,973 -107 | 6,222 82 |
| 2019-20 | 16,670 -260 | 7,356 -379 | 3,261 -52 | 4,095 -327 | 9,314 119 | 2,991 18 | 6,323 101 |
| 2020-21 | 18,070 1,400 | 8,441 1,085 | 3,948 687 | 4,493 398 | 9,629 315 | 2,991 0 | 6,638 315 |
| 2021-22 | 17,135 -935 | 7,648 -793 | 3,601 -347 | 4,047 -446 | 9,487 -142 | 2,720 -271 | 6,767 129 |
| 2022-23 | 18,631 1,496 | 8,485 837 | 3,956 355 | 4,529 482 | 10,146 659 | 2,909 189 | 7,237 470 |
| Average | 17,545 | 8,547 | 3,785 | 4,762 | 8,999 | 2,933 | 6,065 |