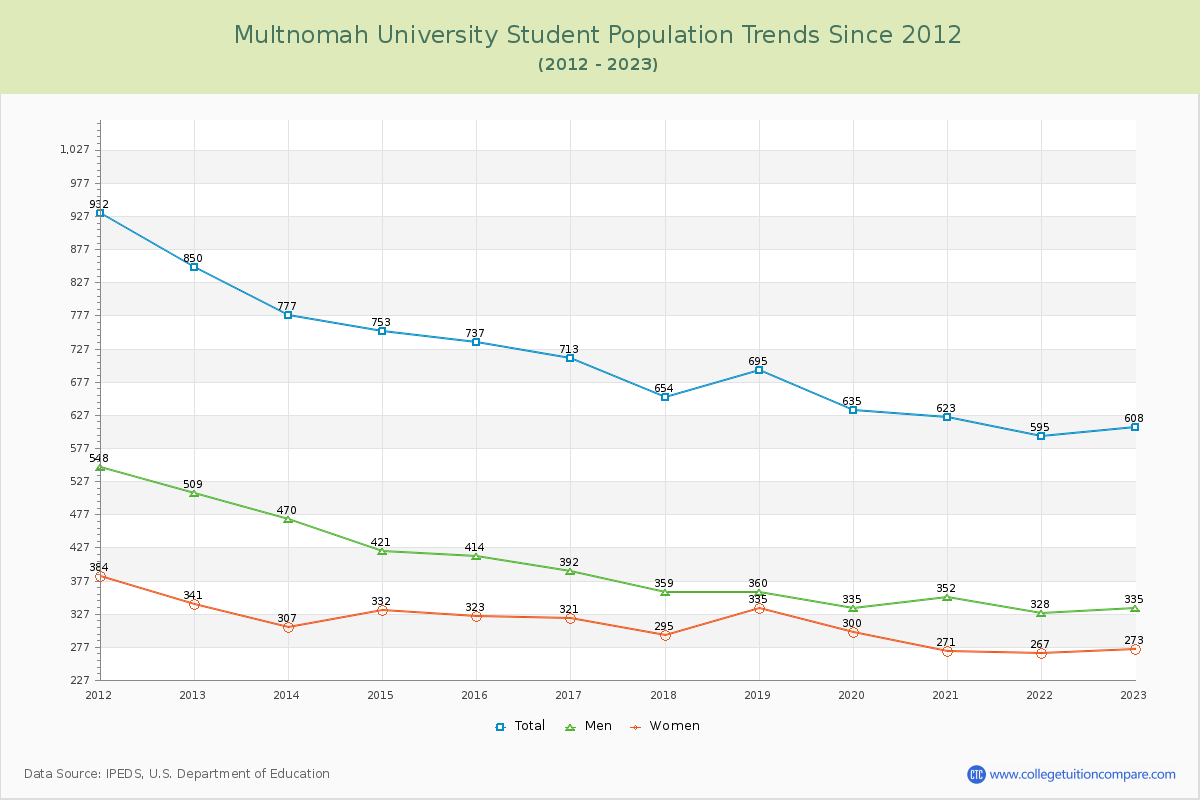
Student Population Changes
The average student population over the last 12 years is 695 where 608 students are attending the school for the academic year 2022-2023.
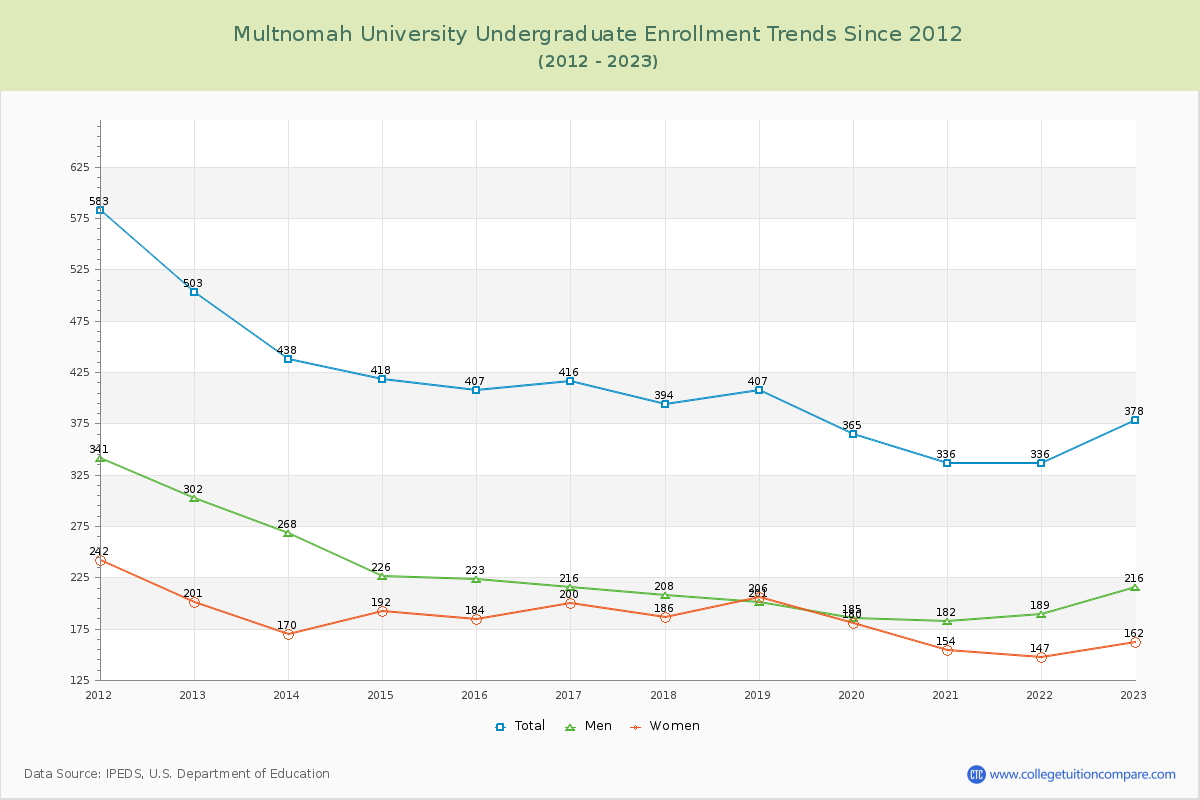
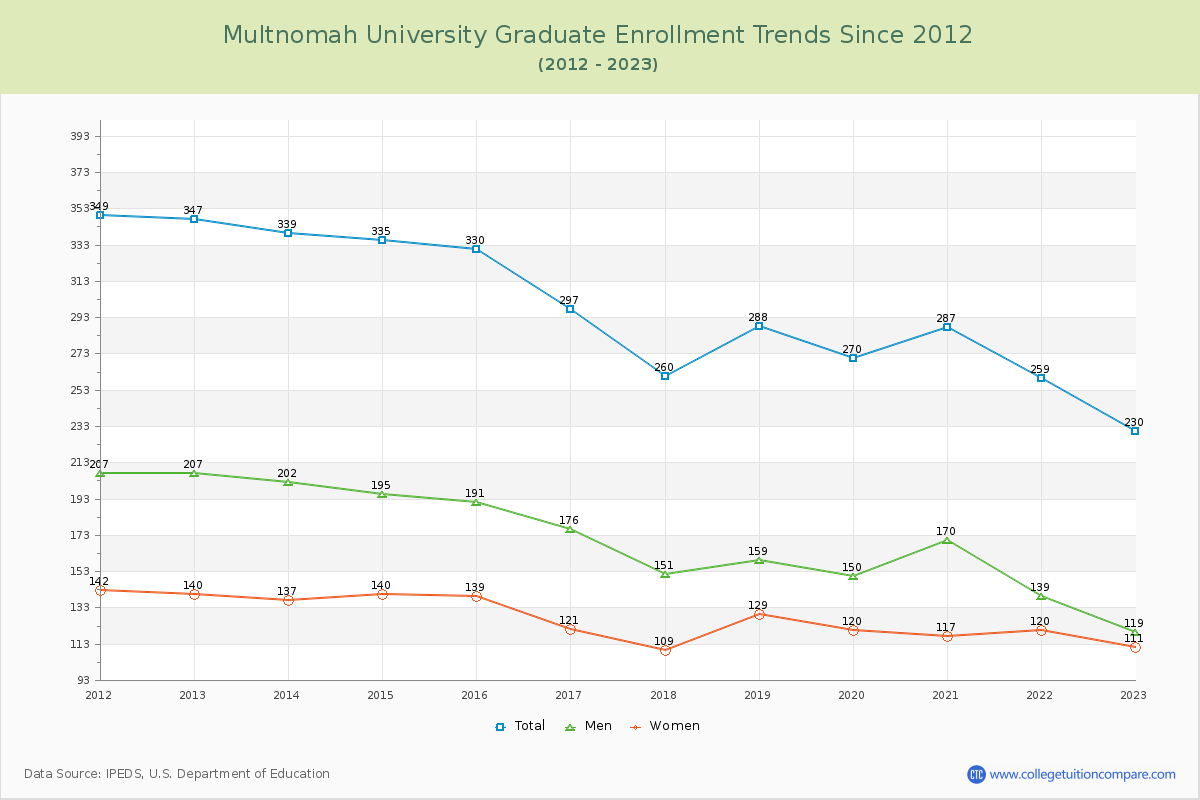
62.17% of total students is undergraduate students and 37.83% students is graduate students. The number of undergraduate students has decreased by 125 and the graduate enrollment has decreased by 117 over past 10 years.
The female to male ratio is 0.81 to 1 and it means that there are slightly more male students enrolled in MBC than female students.
The following table and chart illustrate the changes in student population by gender at Multnomah University since 2012.
| Year | Total | Undergraduate | Graduate | ||||
|---|---|---|---|---|---|---|---|
| Total | Men | Women | Total | Men | Women | ||
| 2012-13 | 850 | 503 | 302 | 201 | 347 | 207 | 140 |
| 2013-14 | 777 -73 | 438 -65 | 268 -34 | 170 -31 | 339 -8 | 202 -5 | 137 -3 |
| 2014-15 | 753 -24 | 418 -20 | 226 -42 | 192 22 | 335 -4 | 195 -7 | 140 3 |
| 2015-16 | 737 -16 | 407 -11 | 223 -3 | 184 -8 | 330 -5 | 191 -4 | 139 -1 |
| 2016-17 | 713 -24 | 416 9 | 216 -7 | 200 16 | 297 -33 | 176 -15 | 121 -18 |
| 2017-18 | 654 -59 | 394 -22 | 208 -8 | 186 -14 | 260 -37 | 151 -25 | 109 -12 |
| 2018-19 | 695 41 | 407 13 | 201 -7 | 206 20 | 288 28 | 159 8 | 129 20 |
| 2019-20 | 635 -60 | 365 -42 | 185 -16 | 180 -26 | 270 -18 | 150 -9 | 120 -9 |
| 2020-21 | 623 -12 | 336 -29 | 182 -3 | 154 -26 | 287 17 | 170 20 | 117 -3 |
| 2021-22 | 595 -28 | 336 0 | 189 7 | 147 -7 | 259 -28 | 139 -31 | 120 3 |
| 2022-23 | 608 13 | 378 42 | 216 27 | 162 15 | 230 -29 | 119 -20 | 111 -9 |
| Average | 695 | 400 | 220 | 180 | 295 | 169 | 126 |