Enrollment Trends at MECC

-602

Total Enrollment

-253

Men

-349

Women

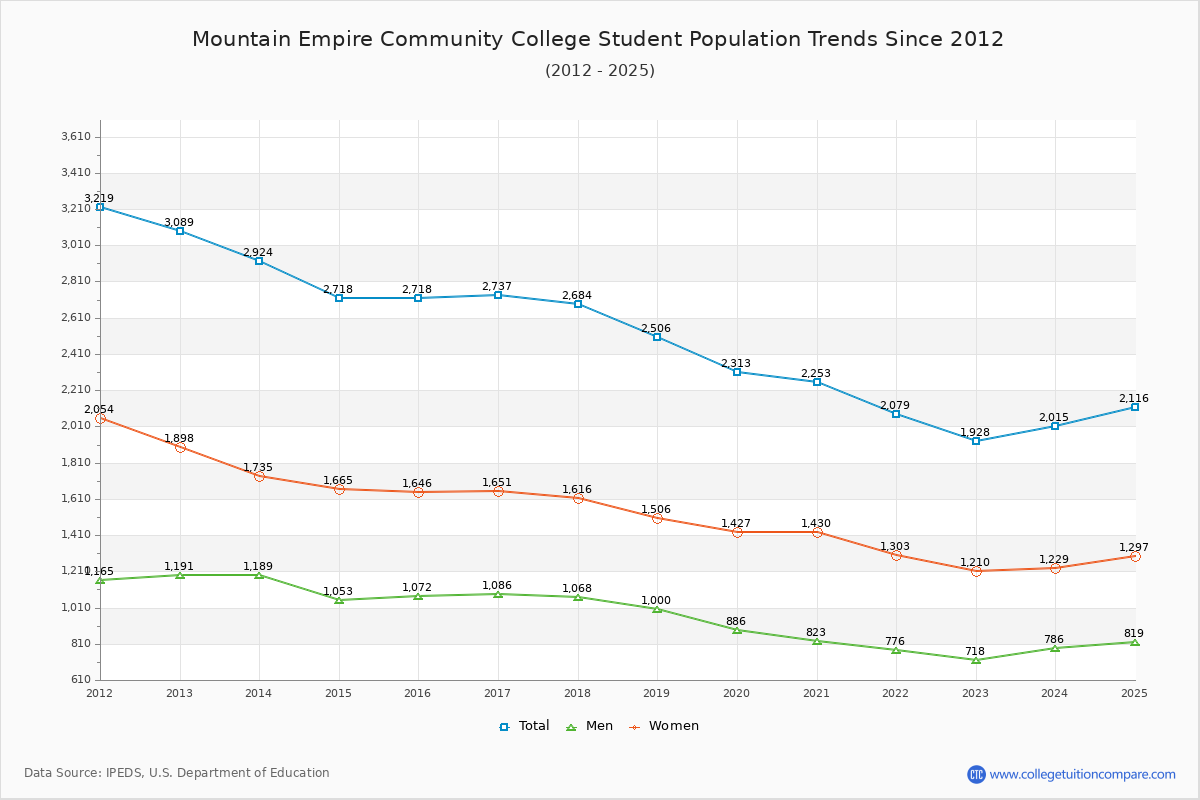
The student population at Mountain Empire Community College is 2,116 (all undergraduate). The number of students has decreased by 602 over the past decade.

The female to male ratio is 1.58 to 1 which means that female students enrolled more than male students.

678 students enrolled in online degree program exclusively and the number of online students has increased by 113.88% since 2015.

Student Population Changes

The average student population over the last 11 years is 2,335 where 2,116 students are attending the school for the academic year 2024-2025.

The female to male ratio is 1.58 to 1 and it means that there are more female students enrolled in MECC than male students.

The following table and chart illustrate the changes in student population by gender at Mountain Empire Community College since 2015.

YearTotalMenWomen
2015-162,7181,0721,646
2016-172,737
19
1,086
14
1,651
5
2017-182,684
-53
1,068
-18
1,616
-35
2018-192,506
-178
1,000
-68
1,506
-110
2019-202,313
-193
886
-114
1,427
-79
2020-212,253
-60
823
-63
1,430
3
2021-222,079
-174
776
-47
1,303
-127
2022-231,928
-151
718
-58
1,210
-93
2023-242,015
87
786
68
1,229
19
2024-252,116
101
819
33
1,297
68
Average2,3359031,432
Mountain Empire Community College Enrollment Trends Chart

Enrollment by Race/Ethnicity Changes

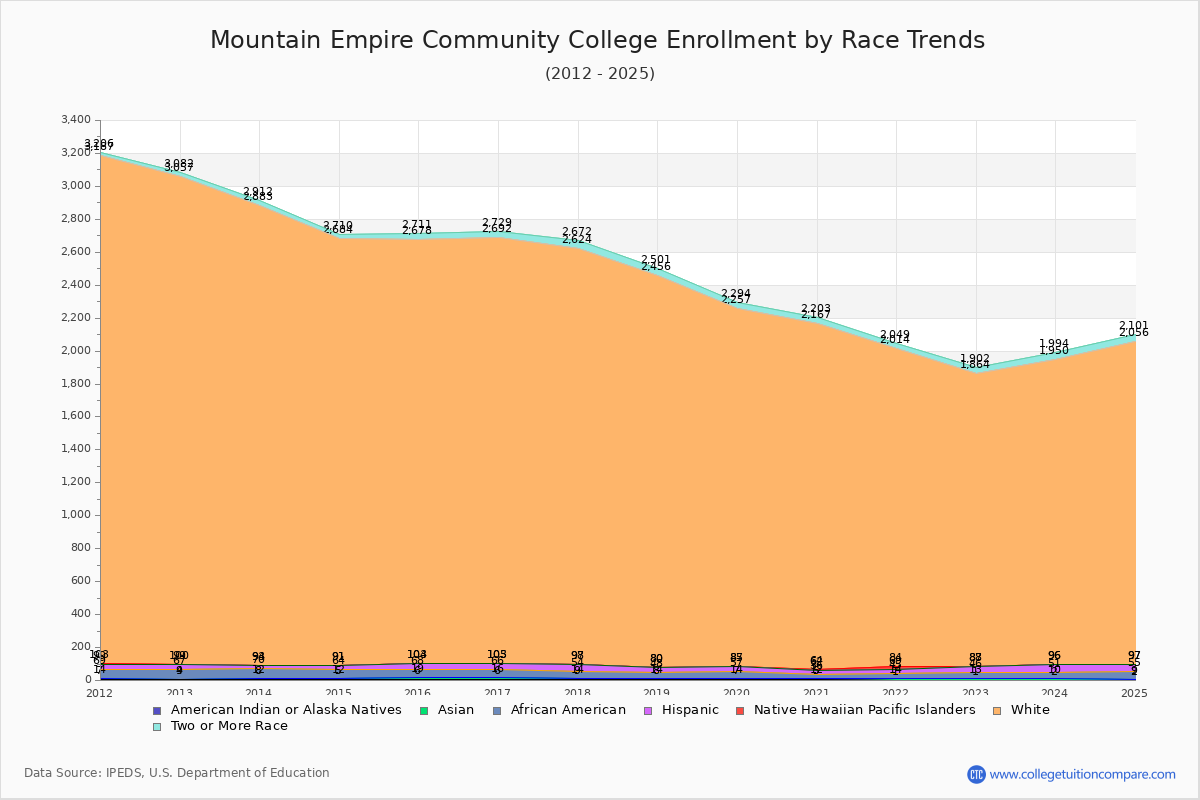
The percentage of white students is 92.58%. The percentage was 94.70% 10 years ago and MECC still has a high percentage of white students. 0.33% of enrolled students is Asian and 2.17% is black students. Hispanic students comprise 1.98% of the student body.

Over the past 10 years, the racial composition has shifted. The percentage of white students decreased from 94.70% to 92.58%. Asian enrollment declined from 0.48% to 0.33%. Black student enrollment increased from 1.80% to 2.17%. Hispanic student representation expanded from 1.29% to 1.98%.

The overall racial diversity, measured by the Census Bureau Diversity Index, is 0.1416 which indicates that not very diverse. This increased from 0.1025 a decade ago, suggesting that racial diversity has improved.

The following table and chart illustrate the student population trends by race/ethnicity at Mountain Empire Community College over the past 11 years (2015-2025).

YearAmerican Indian or Native AmericanAsianBlackHispanicNative Hawaiian or Other Pacific IslanderWhiteTwo or More Races
2015-16613493512,57433
2016-17610503722,58737
2017-1895404312,52648
2018-1986343202,37645
2019-2077432822,17037
2020-2157242622,10336
2021-221133124151,93035
2022-23112334111,77638
2023-2428414501,85444
2024-2527464201,95945
Average59393522,18640
Mountain Empire Community College Enrollment by Race Trends Chart

Distance Learning (Online Courses) Enrollment Changes

678 students are enrolled in online degree programs exclusively for the academic year 2024-2025, which is 32% of total students. The number of online students has increased 113.88% since 2015. The following table and chart illustrate the changes in the online student population by enrolled type at Mountain Empire Community College from 2015 to 2025.

YearTotal EnrollmentOnline CompletelyEnrolled in Some Online CoursesNot Enrolled in Online Courses
2015-162,7183178511,550
2016-172,7373538451,539
2017-182,6843648741,446
2018-192,5064908331,183
2019-202,3134128951,006
2020-212,253835866552
2021-222,079790748541
2022-231,928536810582
2023-242,015609900506
2024-252,116678934504
Average2,335538856941

Ratings & Review

Share your experiences and thoughts about Mountain Empire Community College. It will be a great help to applicants and prospective students!