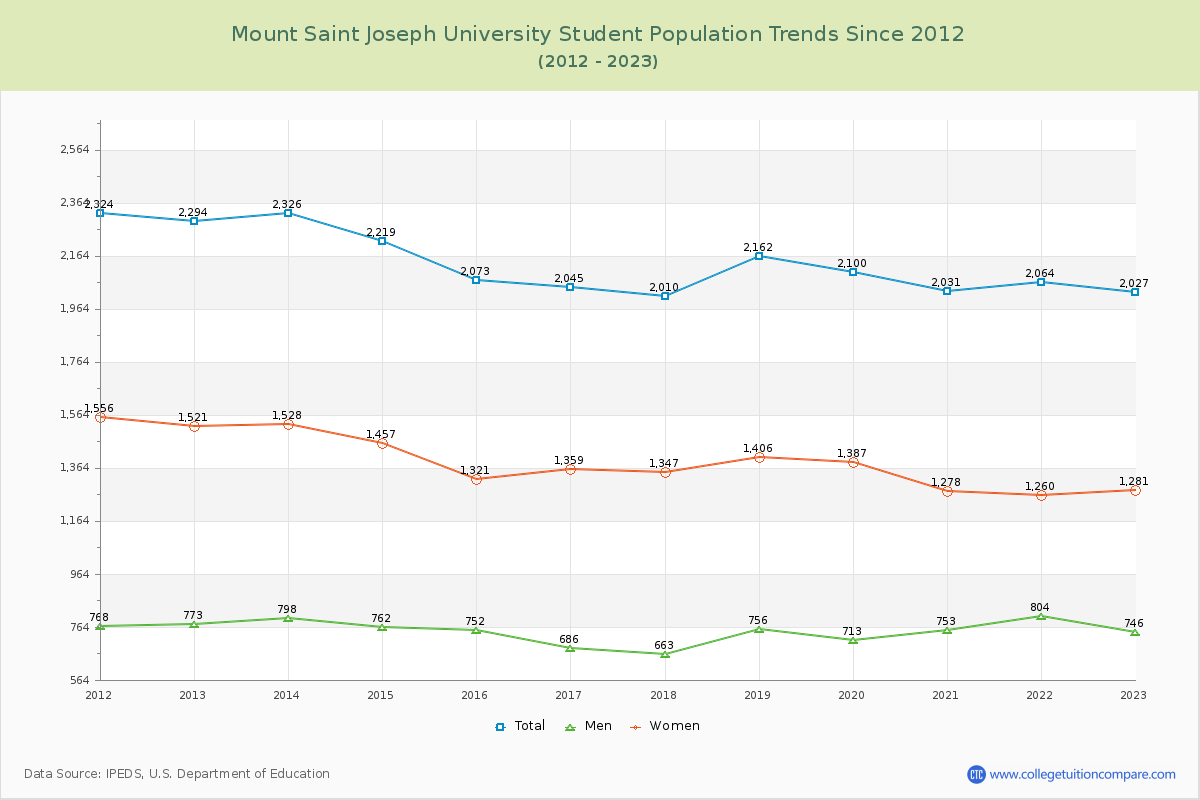
Student Population Changes
The average student population over the last 12 years is 2,123 where 2,027 students are attending the school for the academic year 2022-2023.
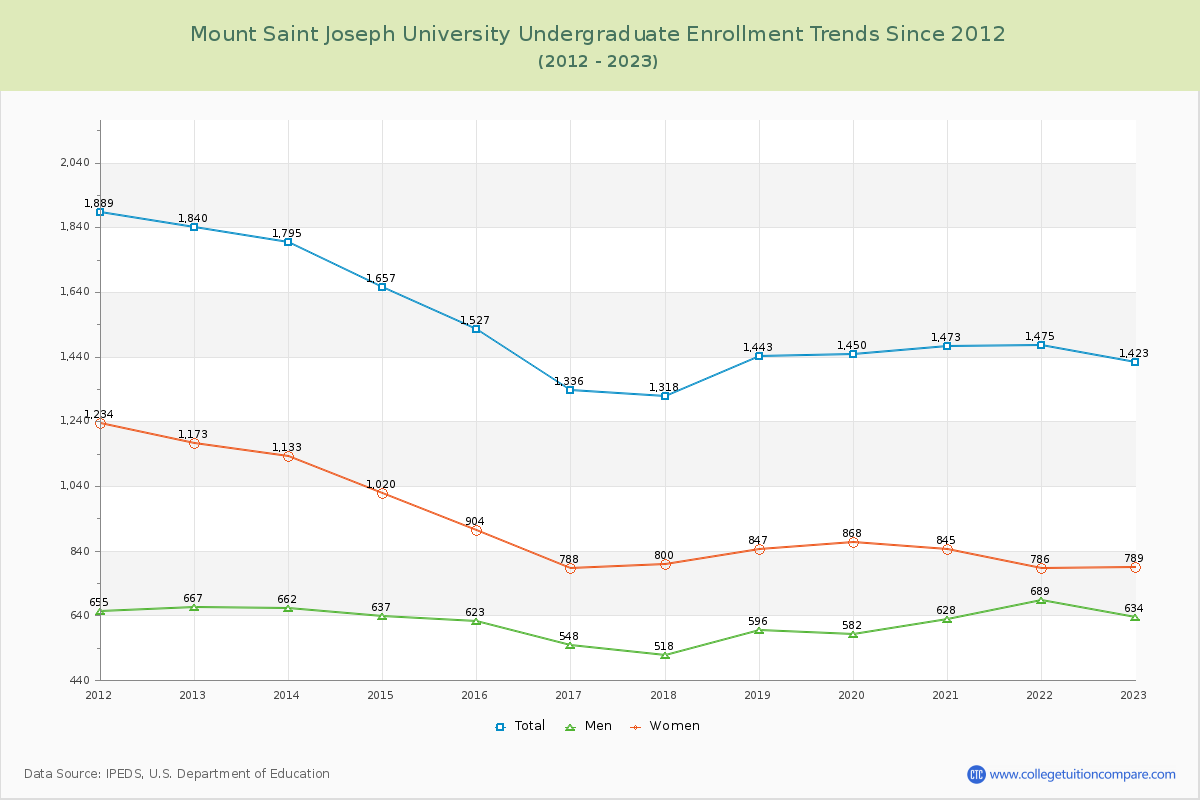
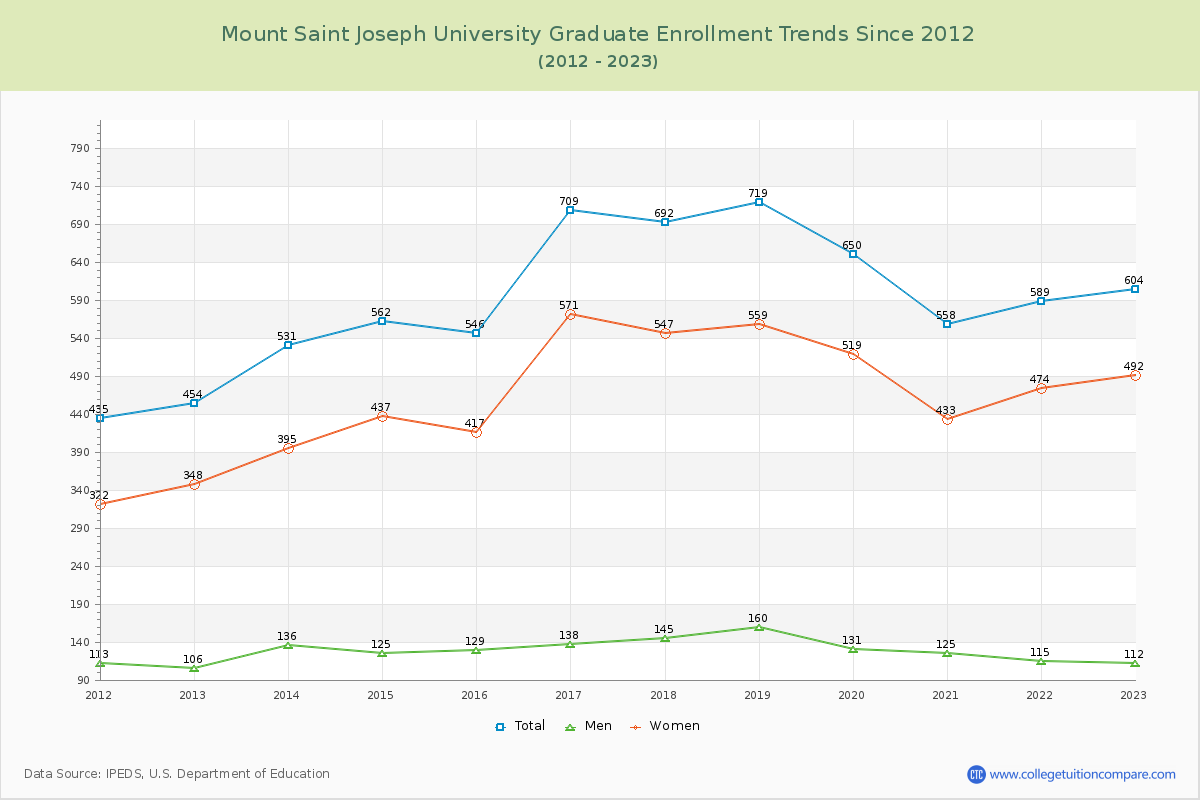
70.20% of total students is undergraduate students and 29.80% students is graduate students. The number of undergraduate students has decreased by 417 and the graduate enrollment has increased by 150 over past 10 years.
The female to male ratio is 1.72 to 1 and it means that there are more female students enrolled in Mount Saint Joseph than male students.
The following table and chart illustrate the changes in student population by gender at Mount Saint Joseph University since 2012.
| Year | Total | Undergraduate | Graduate | ||||
|---|---|---|---|---|---|---|---|
| Total | Men | Women | Total | Men | Women | ||
| 2012-13 | 2,294 | 1,840 | 667 | 1,173 | 454 | 106 | 348 |
| 2013-14 | 2,326 32 | 1,795 -45 | 662 -5 | 1,133 -40 | 531 77 | 136 30 | 395 47 |
| 2014-15 | 2,219 -107 | 1,657 -138 | 637 -25 | 1,020 -113 | 562 31 | 125 -11 | 437 42 |
| 2015-16 | 2,073 -146 | 1,527 -130 | 623 -14 | 904 -116 | 546 -16 | 129 4 | 417 -20 |
| 2016-17 | 2,045 -28 | 1,336 -191 | 548 -75 | 788 -116 | 709 163 | 138 9 | 571 154 |
| 2017-18 | 2,010 -35 | 1,318 -18 | 518 -30 | 800 12 | 692 -17 | 145 7 | 547 -24 |
| 2018-19 | 2,162 152 | 1,443 125 | 596 78 | 847 47 | 719 27 | 160 15 | 559 12 |
| 2019-20 | 2,100 -62 | 1,450 7 | 582 -14 | 868 21 | 650 -69 | 131 -29 | 519 -40 |
| 2020-21 | 2,031 -69 | 1,473 23 | 628 46 | 845 -23 | 558 -92 | 125 -6 | 433 -86 |
| 2021-22 | 2,064 33 | 1,475 2 | 689 61 | 786 -59 | 589 31 | 115 -10 | 474 41 |
| 2022-23 | 2,027 -37 | 1,423 -52 | 634 -55 | 789 3 | 604 15 | 112 -3 | 492 18 |
| Average | 2,123 | 1,522 | 617 | 905 | 601 | 129 | 472 |