Enrollment Trends at Morgan CC

-21

Total Enrollment

-1

Men

-20

Women

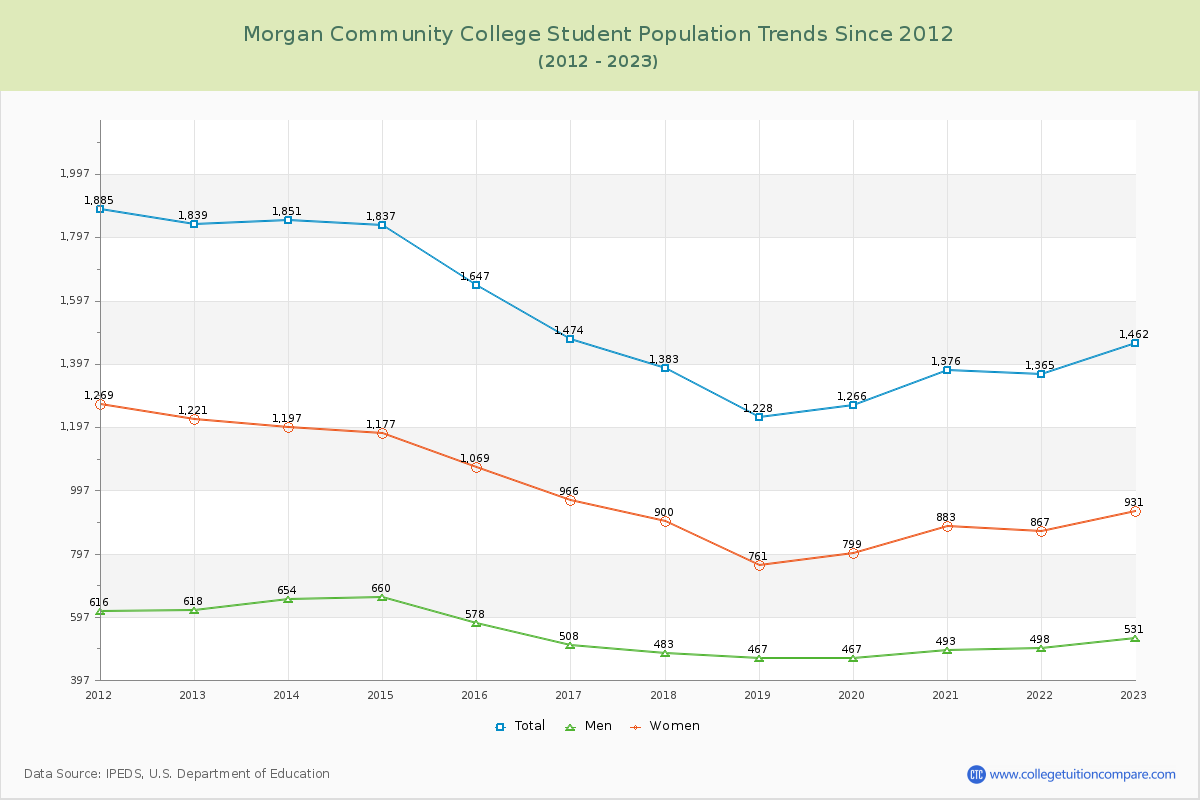
The student population at Morgan Community College is 1,626 (all undergraduate). The number of students has decreased by 21 over the past decade.

The female to male ratio is 1.82 to 1 which means that female students enrolled more than male students.

390 students enrolled in online degree program exclusively and the number of online students has increased by 83.10% since 2015.

Student Population Changes

The average student population over the last 11 years is 1,433 where 1,626 students are attending the school for the academic year 2024-2025.

The female to male ratio is 1.82 to 1 and it means that there are more female students enrolled in Morgan CC than male students.

The following table and chart illustrate the changes in student population by gender at Morgan Community College since 2015.

YearTotalMenWomen
2015-161,6475781,069
2016-171,474
-173
508
-70
966
-103
2017-181,383
-91
483
-25
900
-66
2018-191,228
-155
467
-16
761
-139
2019-201,266
38
467799
38
2020-211,376
110
493
26
883
84
2021-221,365
-11
498
5
867
-16
2022-231,462
97
531
33
931
64
2023-241,506
44
519
-12
987
56
2024-251,626
120
577
58
1,049
62
Average1,433512921
Morgan Community College Enrollment Trends Chart

Enrollment by Race/Ethnicity Changes

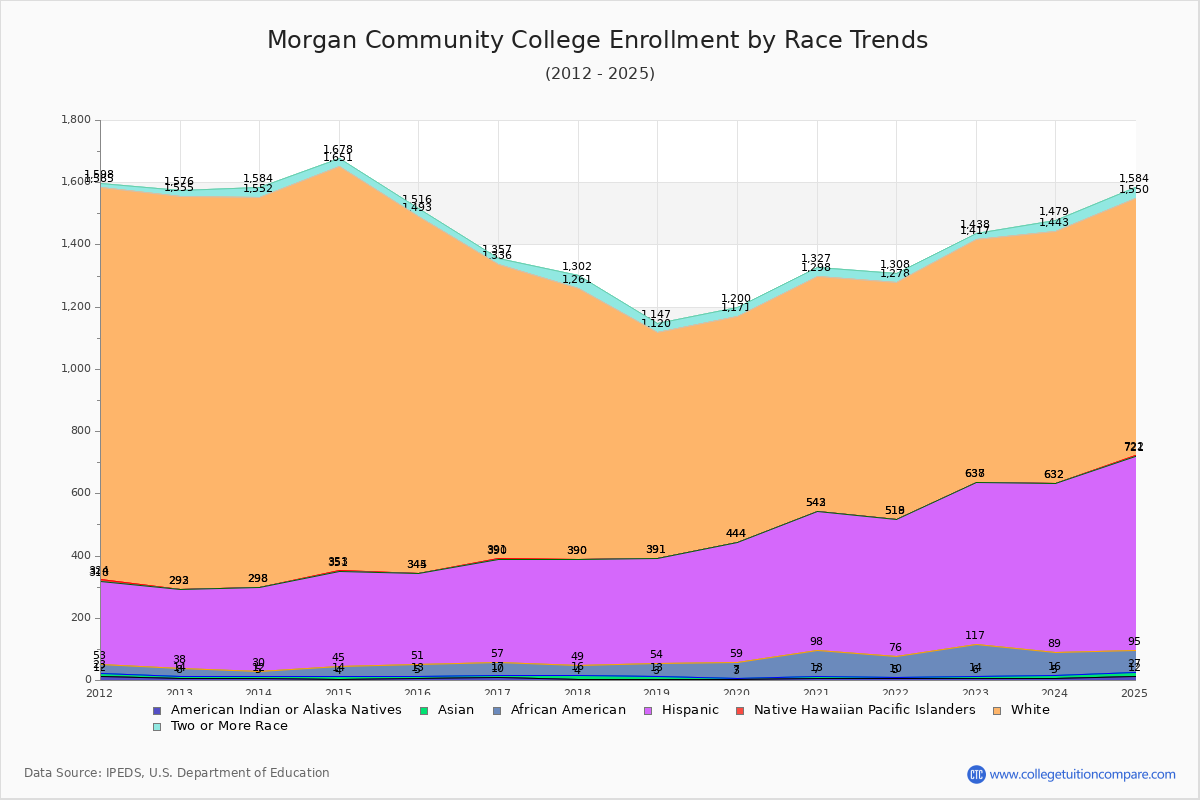
The percentage of white students is 50.92%. The percentage was 69.70% 10 years ago and Morgan CC still has a high percentage of white students. 0.92% of enrolled students is Asian and 4.18% is black students. Hispanic students comprise 38.50% of the student body.

Over the past 10 years, the racial composition has shifted. The percentage of white students decreased from 69.70% to 50.92%. Asian enrollment grew from 0.49% to 0.92%. Black student enrollment increased from 2.31% to 4.18%. Hispanic student representation expanded from 17.79% to 38.50%.

The overall racial diversity, measured by the Census Bureau Diversity Index, is 0.5901 which indicates that moderately diverse. This increased from 0.4817 a decade ago, suggesting that racial diversity has improved.

The following table and chart illustrate the student population trends by race/ethnicity at Morgan Community College over the past 11 years (2015-2025).

YearAmerican Indian or Native AmericanAsianBlackHispanicNative Hawaiian or Other Pacific IslanderWhiteTwo or More Races
2015-16583829311,14823
2016-1710740333194521
2017-1841233341087141
2018-1931041337072927
2019-203452385072729
2020-217685444175529
2021-225566442175930
2022-2368103520177921
2023-2451173543081136
2024-25121568626182834
Average6960426183529
Morgan Community College Enrollment by Race Trends Chart

Distance Learning (Online Courses) Enrollment Changes

390 students are enrolled in online degree programs exclusively for the academic year 2024-2025, which is 24% of total students. The number of online students has increased 83.10% since 2015. The following table and chart illustrate the changes in the online student population by enrolled type at Morgan Community College from 2015 to 2025.

YearTotal EnrollmentOnline CompletelyEnrolled in Some Online CoursesNot Enrolled in Online Courses
2015-161,6472132451,189
2016-171,474252283939
2017-181,383410380593
2018-191,228416270542
2019-201,266421326519
2020-211,376580357439
2021-221,365361340664
2022-231,462136378948
2023-241,506352414740
2024-251,626390406830
Average1,433353340740

Ratings & Review

Share your experiences and thoughts about Morgan Community College. It will be a great help to applicants and prospective students!