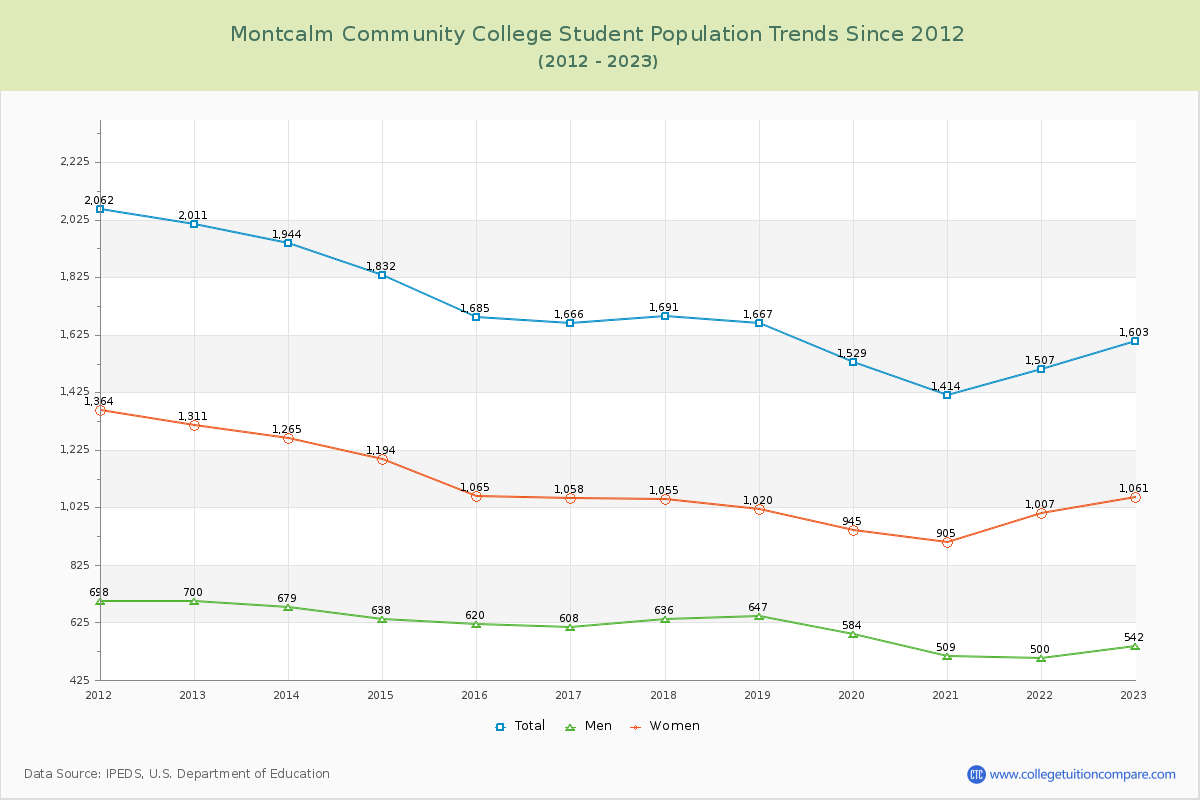
Student Population Changes
The average student population over the last 12 years is 1,686 where 1,603 students are attending the school for the academic year 2022-2023.
The female to male ratio is 1.96 to 1 and it means that there are more female students enrolled in Montcalm CC than male students.
The following table and chart illustrate the changes in student population by gender at Montcalm Community College since 2012.
| Year | Total | Men | Women |
|---|---|---|---|
| 2012-13 | 2,011 | 700 | 1,311 |
| 2013-14 | 1,944 -67 | 679 -21 | 1,265 -46 |
| 2014-15 | 1,832 -112 | 638 -41 | 1,194 -71 |
| 2015-16 | 1,685 -147 | 620 -18 | 1,065 -129 |
| 2016-17 | 1,666 -19 | 608 -12 | 1,058 -7 |
| 2017-18 | 1,691 25 | 636 28 | 1,055 -3 |
| 2018-19 | 1,667 -24 | 647 11 | 1,020 -35 |
| 2019-20 | 1,529 -138 | 584 -63 | 945 -75 |
| 2020-21 | 1,414 -115 | 509 -75 | 905 -40 |
| 2021-22 | 1,507 93 | 500 -9 | 1,007 102 |
| 2022-23 | 1,603 96 | 542 42 | 1,061 54 |
| Average | 1,686 | 606 | 1,081 |