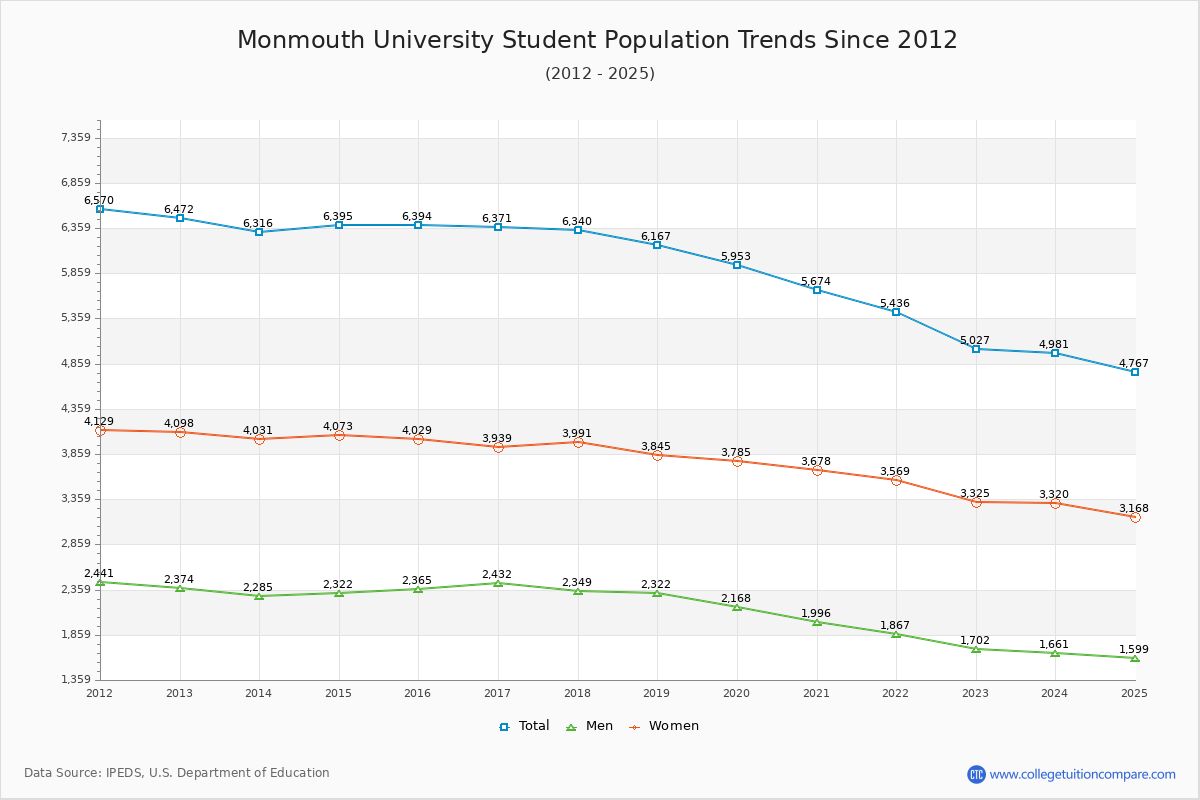
Student Population Changes
The average student population over the last 12 years is 6,050 where 5,027 students are attending the school for the academic year 2022-2023.
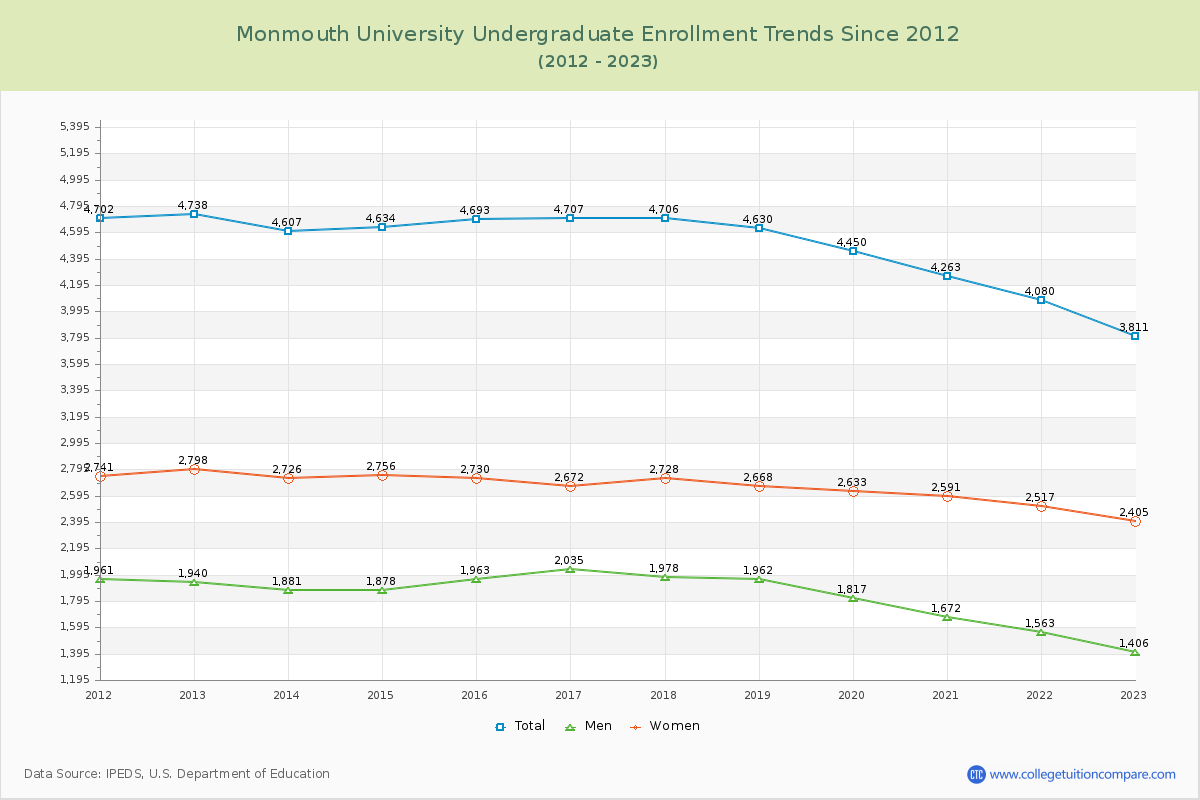
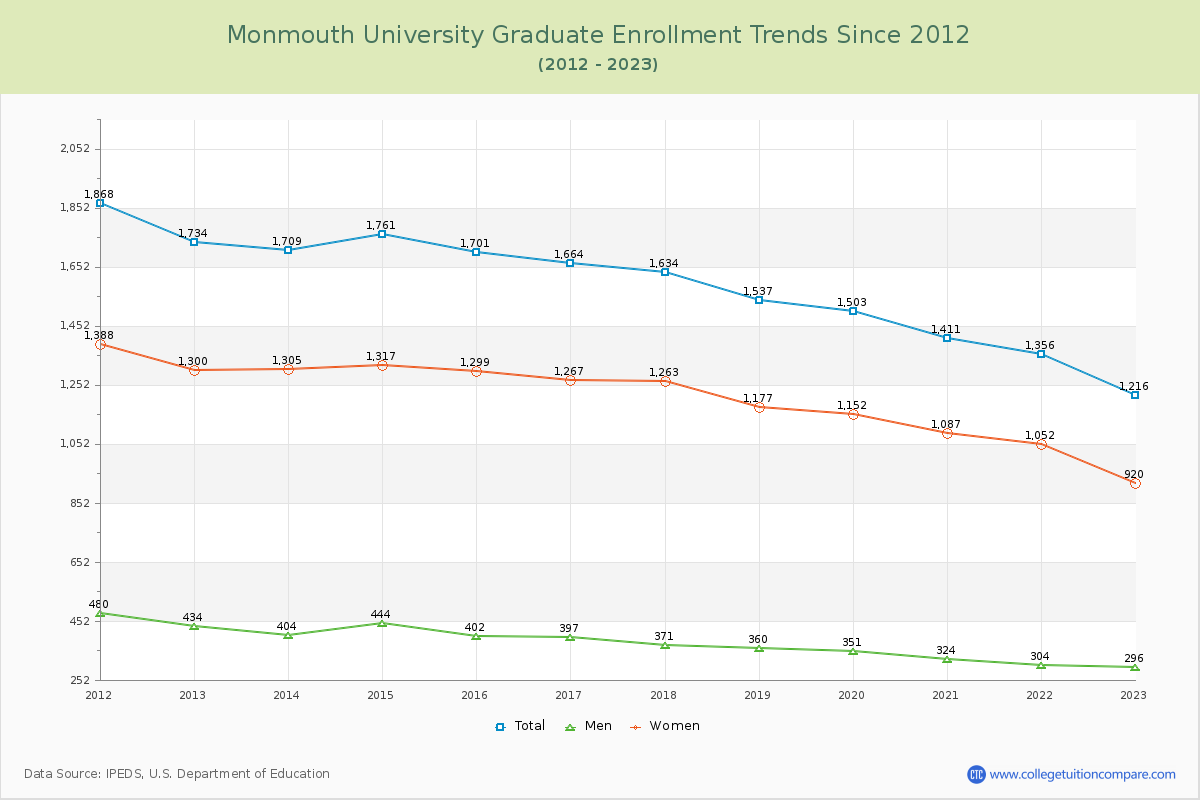
75.81% of total students is undergraduate students and 24.19% students is graduate students. The number of undergraduate students has decreased by 927 and the graduate enrollment has decreased by 518 over past 10 years.
The female to male ratio is 1.95 to 1 and it means that there are more female students enrolled in Monmouth than male students.
The following table and chart illustrate the changes in student population by gender at Monmouth University since 2012.
| Year | Total | Undergraduate | Graduate | ||||
|---|---|---|---|---|---|---|---|
| Total | Men | Women | Total | Men | Women | ||
| 2012-13 | 6,472 | 4,738 | 1,940 | 2,798 | 1,734 | 434 | 1,300 |
| 2013-14 | 6,316 -156 | 4,607 -131 | 1,881 -59 | 2,726 -72 | 1,709 -25 | 404 -30 | 1,305 5 |
| 2014-15 | 6,395 79 | 4,634 27 | 1,878 -3 | 2,756 30 | 1,761 52 | 444 40 | 1,317 12 |
| 2015-16 | 6,394 -1 | 4,693 59 | 1,963 85 | 2,730 -26 | 1,701 -60 | 402 -42 | 1,299 -18 |
| 2016-17 | 6,371 -23 | 4,707 14 | 2,035 72 | 2,672 -58 | 1,664 -37 | 397 -5 | 1,267 -32 |
| 2017-18 | 6,340 -31 | 4,706 -1 | 1,978 -57 | 2,728 56 | 1,634 -30 | 371 -26 | 1,263 -4 |
| 2018-19 | 6,167 -173 | 4,630 -76 | 1,962 -16 | 2,668 -60 | 1,537 -97 | 360 -11 | 1,177 -86 |
| 2019-20 | 5,953 -214 | 4,450 -180 | 1,817 -145 | 2,633 -35 | 1,503 -34 | 351 -9 | 1,152 -25 |
| 2020-21 | 5,674 -279 | 4,263 -187 | 1,672 -145 | 2,591 -42 | 1,411 -92 | 324 -27 | 1,087 -65 |
| 2021-22 | 5,436 -238 | 4,080 -183 | 1,563 -109 | 2,517 -74 | 1,356 -55 | 304 -20 | 1,052 -35 |
| 2022-23 | 5,027 -409 | 3,811 -269 | 1,406 -157 | 2,405 -112 | 1,216 -140 | 296 -8 | 920 -132 |
| Average | 6,050 | 4,484 | 1,827 | 2,657 | 1,566 | 372 | 1,194 |