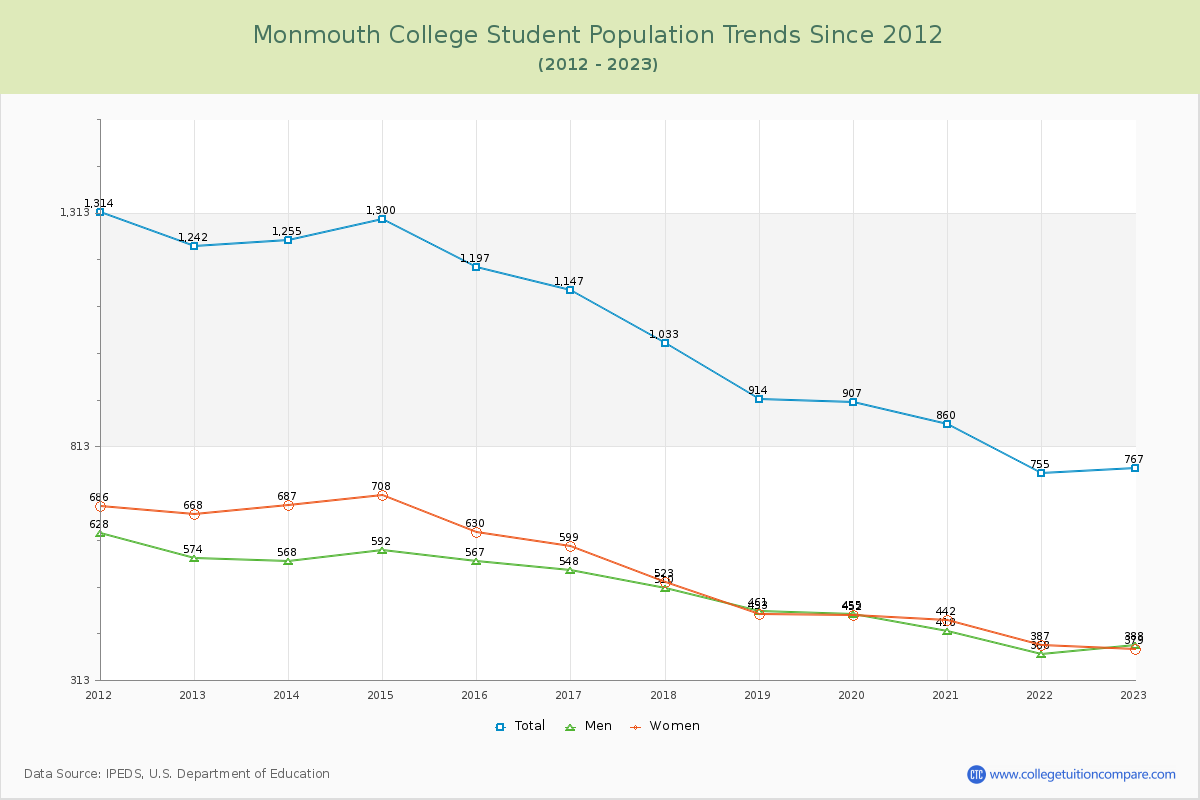
Student Population Changes
The average student population over the last 12 years is 1,034 where 767 students are attending the school for the academic year 2022-2023.
The female to male ratio is 0.98 to 1 and it means that there are similar numbers of female and male students enrolled in Monmouth.
The following table and chart illustrate the changes in student population by gender at Monmouth College since 2012.
| Year | Total | Men | Women |
|---|---|---|---|
| 2012-13 | 1,242 | 574 | 668 |
| 2013-14 | 1,255 13 | 568 -6 | 687 19 |
| 2014-15 | 1,300 45 | 592 24 | 708 21 |
| 2015-16 | 1,197 -103 | 567 -25 | 630 -78 |
| 2016-17 | 1,147 -50 | 548 -19 | 599 -31 |
| 2017-18 | 1,033 -114 | 510 -38 | 523 -76 |
| 2018-19 | 914 -119 | 461 -49 | 453 -70 |
| 2019-20 | 907 -7 | 455 -6 | 452 -1 |
| 2020-21 | 860 -47 | 418 -37 | 442 -10 |
| 2021-22 | 755 -105 | 368 -50 | 387 -55 |
| 2022-23 | 767 12 | 388 20 | 379 -8 |
| Average | 1,034 | 495 | 539 |