Enrollment Trends at MACC

521

Total Enrollment

-39

Men

560

Women

The student population at Moberly Area Community College is 5,384 (all undergraduate). The number of students has increased by 521 over the past decade.

The female to male ratio is 1.70 to 1 which means that female students enrolled more than male students.

1,826 students enrolled in online degree program exclusively and the number of online students has increased by 126.55% since 2015.

Student Population Changes

The average student population over the last 11 years is 4,966 where 5,384 students are attending the school for the academic year 2024-2025.

The female to male ratio is 1.70 to 1 and it means that there are more female students enrolled in MACC than male students.

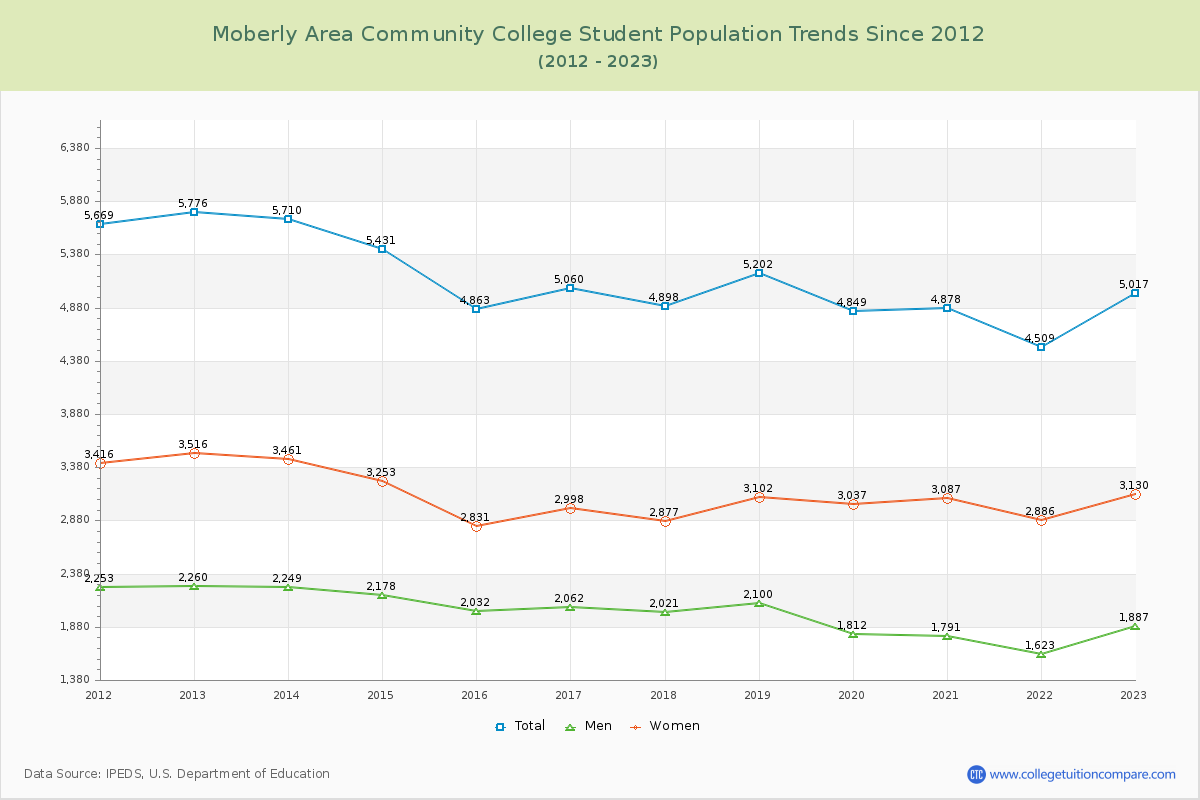
The following table and chart illustrate the changes in student population by gender at Moberly Area Community College since 2015.

YearTotalMenWomen
2015-164,8632,0322,831
2016-175,060
197
2,062
30
2,998
167
2017-184,898
-162
2,021
-41
2,877
-121
2018-195,202
304
2,100
79
3,102
225
2019-204,849
-353
1,812
-288
3,037
-65
2020-214,878
29
1,791
-21
3,087
50
2021-224,509
-369
1,623
-168
2,886
-201
2022-235,017
508
1,887
264
3,130
244
2023-244,997
-20
1,870
-17
3,127
-3
2024-255,384
387
1,993
123
3,391
264
Average4,9661,9193,047
Moberly Area Community College Enrollment Trends Chart

Enrollment by Race/Ethnicity Changes

The percentage of white students is 77.17%. The percentage was 80.88% 10 years ago and MACC still has a high percentage of white students. 1.50% of enrolled students is Asian and 7.89% is black students. Hispanic students comprise 5.42% of the student body.

Over the past 10 years, the racial composition has shifted. The percentage of white students decreased from 80.88% to 77.17%. Asian enrollment declined from 1.83% to 1.50%. Black student enrollment decreased from 7.92% to 7.89%. Hispanic student representation expanded from 3.27% to 5.42%.

The overall racial diversity, measured by the Census Bureau Diversity Index, is 0.3931 which indicates that somewhat diverse. This increased from 0.3372 a decade ago, suggesting that racial diversity has improved.

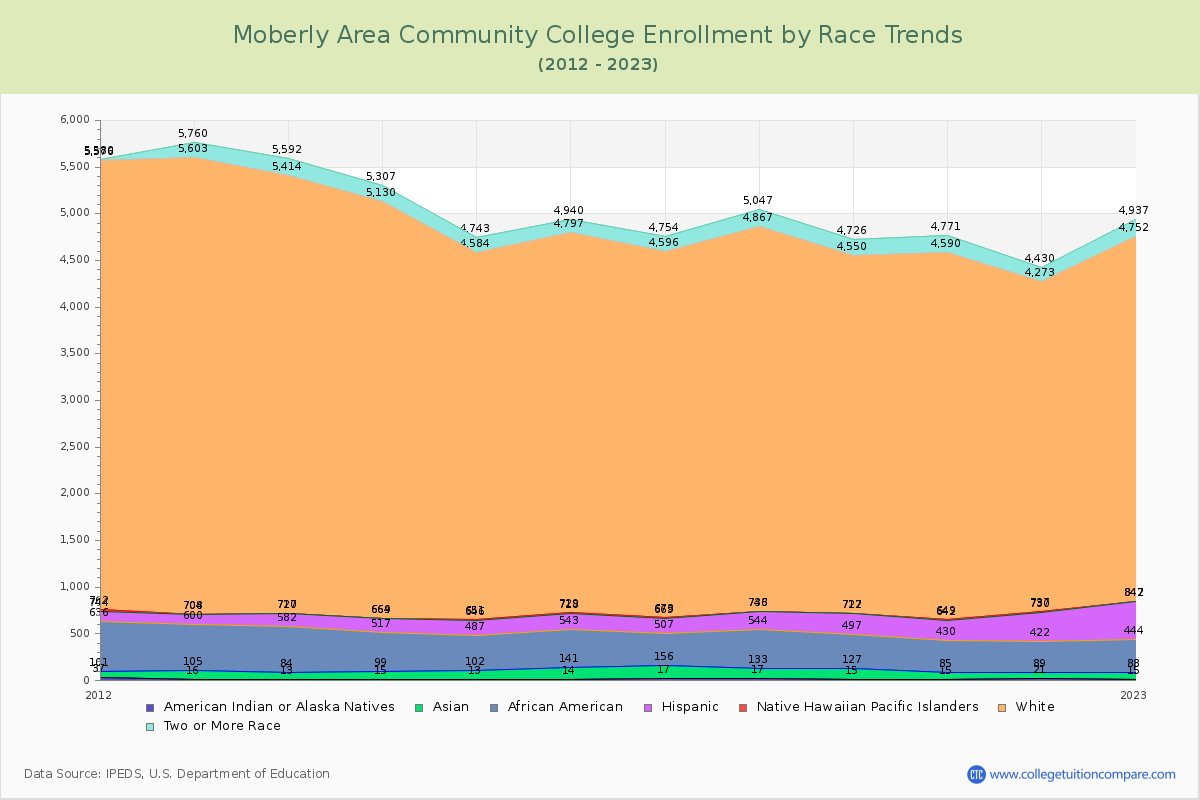
The following table and chart illustrate the student population trends by race/ethnicity at Moberly Area Community College over the past 11 years (2015-2025).

YearAmerican Indian or Native AmericanAsianBlackHispanicNative Hawaiian or Other Pacific IslanderWhiteTwo or More Races
2015-16138938515953,933159
2016-1714127402175114,068143
2017-181713935116243,923158
2018-191711641119274,124180
2019-201511237022053,828176
2020-21157034521273,941181
2021-22216833330873,536157
2022-23157335639853,905185
2023-24168138230563,872197
2024-25168142529234,155239
Average169637624263,929178
Moberly Area Community College Enrollment by Race Trends Chart

Distance Learning (Online Courses) Enrollment Changes

1,826 students are enrolled in online degree programs exclusively for the academic year 2024-2025, which is 34% of total students. The number of online students has increased 126.55% since 2015. The following table and chart illustrate the changes in the online student population by enrolled type at Moberly Area Community College from 2015 to 2025.

YearTotal EnrollmentOnline CompletelyEnrolled in Some Online CoursesNot Enrolled in Online Courses
2015-164,8638061,4312,626
2016-175,0607651,3372,958
2017-184,8981,2061,5082,184
2018-195,2021,3181,7752,109
2019-204,8491,4471,6281,774
2020-214,8783,551634693
2021-224,5092,2861,333890
2022-235,0171,8251,5421,650
2023-244,9971,7091,5921,696
2024-255,3841,8261,8351,723
Average4,9661,6741,4621,830

Ratings & Review

Share your experiences and thoughts about Moberly Area Community College. It will be a great help to applicants and prospective students!