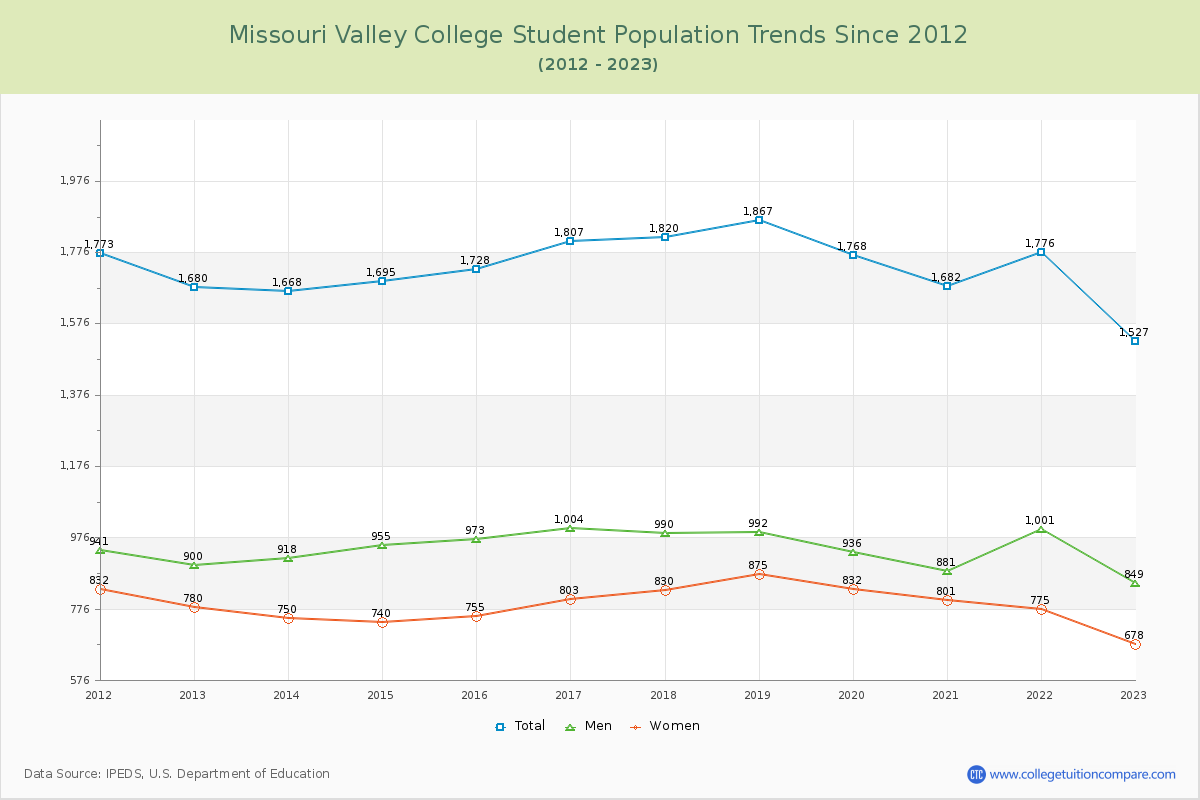
Student Population Changes
The average student population over the last 12 years is 1,729 where 1,527 students are attending the school for the academic year 2022-2023.
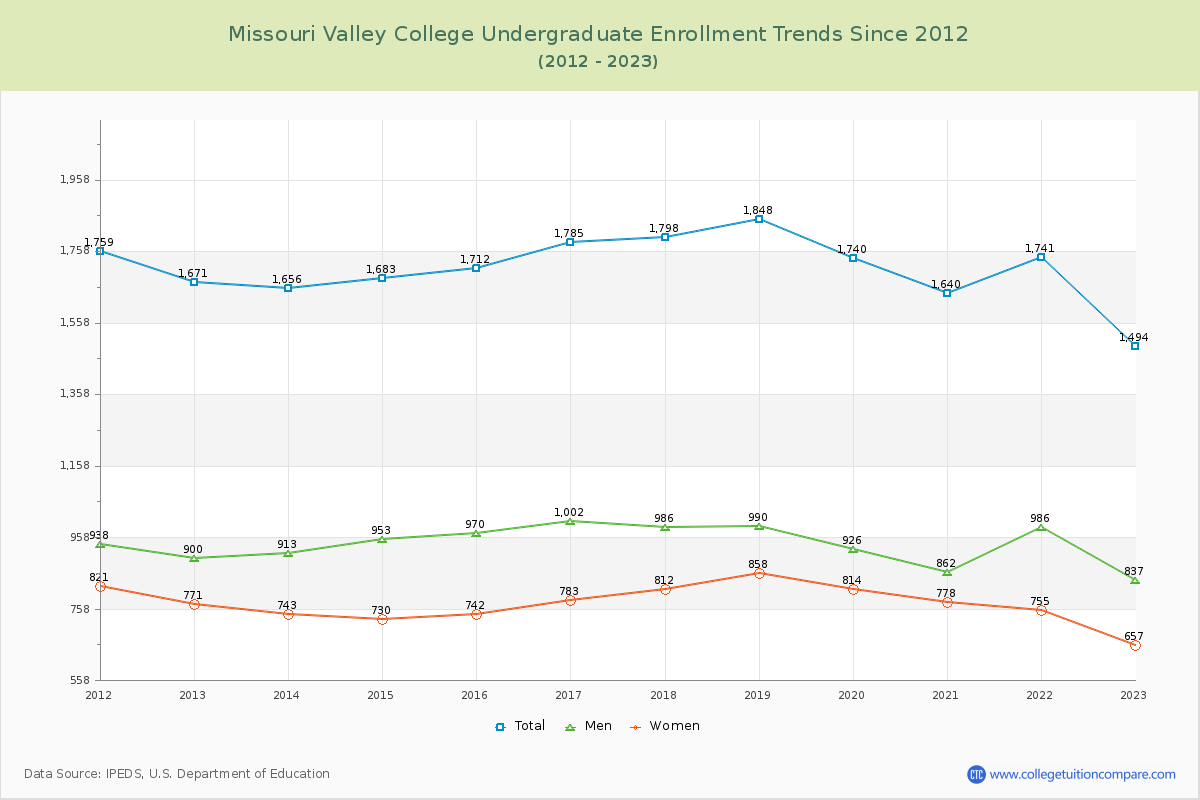
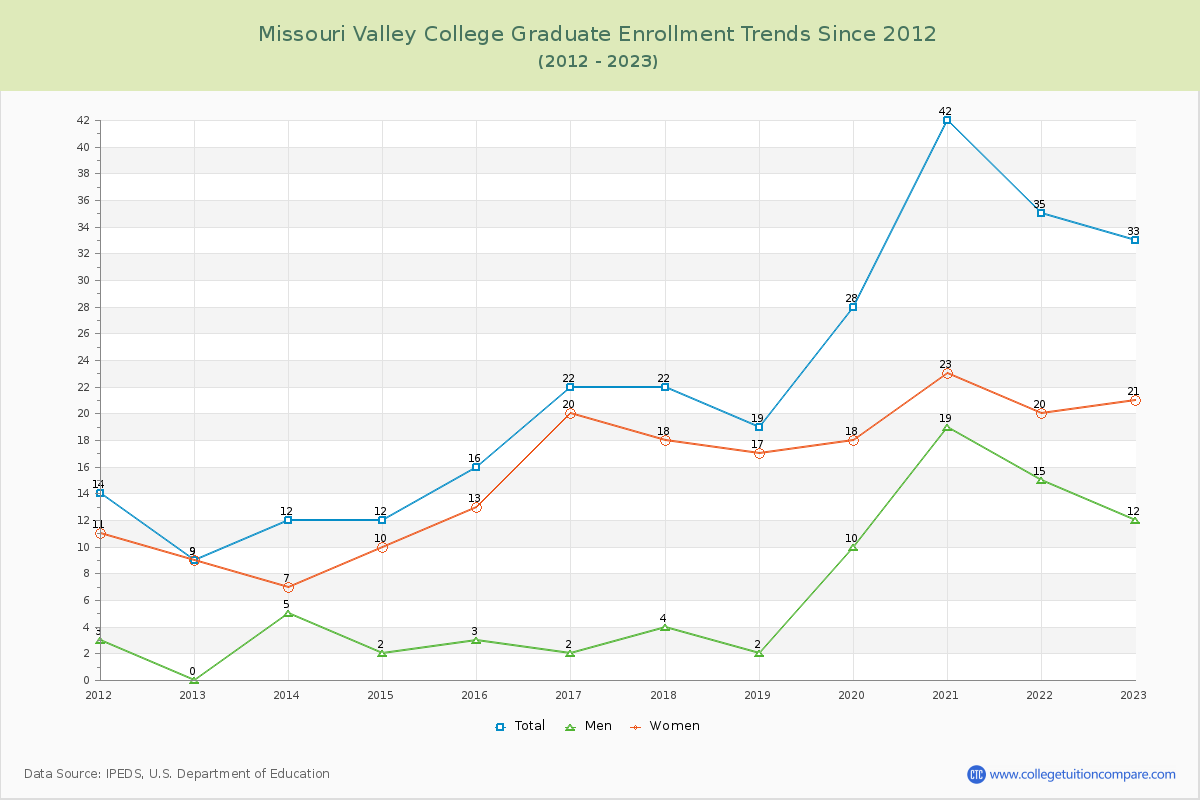
97.84% of total students is undergraduate students and 2.16% students is graduate students. The number of undergraduate students has decreased by 177 and the graduate enrollment has increased by 24 over past 10 years.
The female to male ratio is 0.80 to 1 and it means that there are more male students enrolled in Missouri Valley than female students.
The following table and chart illustrate the changes in student population by gender at Missouri Valley College since 2012.
| Year | Total | Undergraduate | Graduate | ||||
|---|---|---|---|---|---|---|---|
| Total | Men | Women | Total | Men | Women | ||
| 2012-13 | 1,680 | 1,671 | 900 | 771 | 9 | 0 | 9 |
| 2013-14 | 1,668 -12 | 1,656 -15 | 913 13 | 743 -28 | 12 3 | 5 5 | 7 -2 |
| 2014-15 | 1,695 27 | 1,683 27 | 953 40 | 730 -13 | 12 0 | 2 -3 | 10 3 |
| 2015-16 | 1,728 33 | 1,712 29 | 970 17 | 742 12 | 16 4 | 3 1 | 13 3 |
| 2016-17 | 1,807 79 | 1,785 73 | 1,002 32 | 783 41 | 22 6 | 2 -1 | 20 7 |
| 2017-18 | 1,820 13 | 1,798 13 | 986 -16 | 812 29 | 22 0 | 4 2 | 18 -2 |
| 2018-19 | 1,867 47 | 1,848 50 | 990 4 | 858 46 | 19 -3 | 2 -2 | 17 -1 |
| 2019-20 | 1,768 -99 | 1,740 -108 | 926 -64 | 814 -44 | 28 9 | 10 8 | 18 1 |
| 2020-21 | 1,682 -86 | 1,640 -100 | 862 -64 | 778 -36 | 42 14 | 19 9 | 23 5 |
| 2021-22 | 1,776 94 | 1,741 101 | 986 124 | 755 -23 | 35 -7 | 15 -4 | 20 -3 |
| 2022-23 | 1,527 -249 | 1,494 -247 | 837 -149 | 657 -98 | 33 -2 | 12 -3 | 21 1 |
| Average | 1,729 | 1,706 | 939 | 768 | 23 | 7 | 16 |