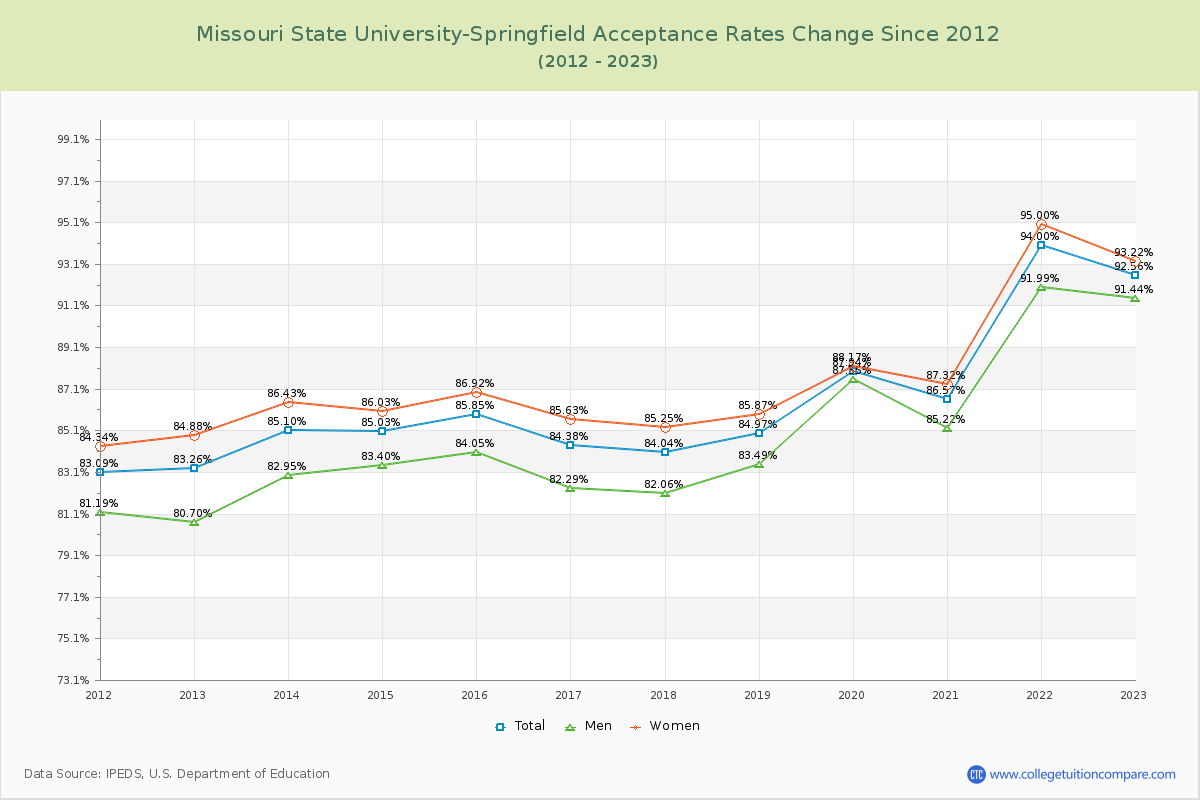
Acceptance Rate Changes
The average acceptance rate over the last 10 years is 86.70%, and this year's acceptance rate is 92.56% at Missouri State University-Springfield. By gender, men students' acceptance rate is 85.01% and women students' rate is 87.70%.
The next table and chart illustrate the acceptance rates changes at Missouri State University-Springfield over the past 11 years (2012-2023).
| Year | Total | Men | Women |
|---|---|---|---|
| 2012-13 | 83.26% | 80.70% | 84.88% |
| 2013-14 | 85.10% 1.84% |
82.95% 1.54% |
86.43% 1.54% |
| 2014-15 | 85.03% -0.07% |
83.40% -0.40% |
86.03% -0.40% |
| 2015-16 | 85.85% 0.82% |
84.05% 0.89% |
86.92% 0.89% |
| 2016-17 | 84.38% -1.47% |
82.29% -1.29% |
85.63% -1.29% |
| 2017-18 | 84.04% -0.34% |
82.06% -0.38% |
85.25% -0.38% |
| 2018-19 | 84.97% 0.93% |
83.49% 0.62% |
85.87% 0.62% |
| 2019-20 | 87.94% 2.97% |
87.55% 2.30% |
88.17% 2.30% |
| 2020-21 | 86.57% -1.37% |
85.22% -0.86% |
87.32% -0.86% |
| 2021-22 | 94.00% 7.42% |
91.99% 7.69% |
95.00% 7.69% |
| 2022-23 | 92.56% -1.43% |
91.44% -1.78% |
93.22% -1.78% |
| Average | 86.70% | 85.01% | 87.70% |