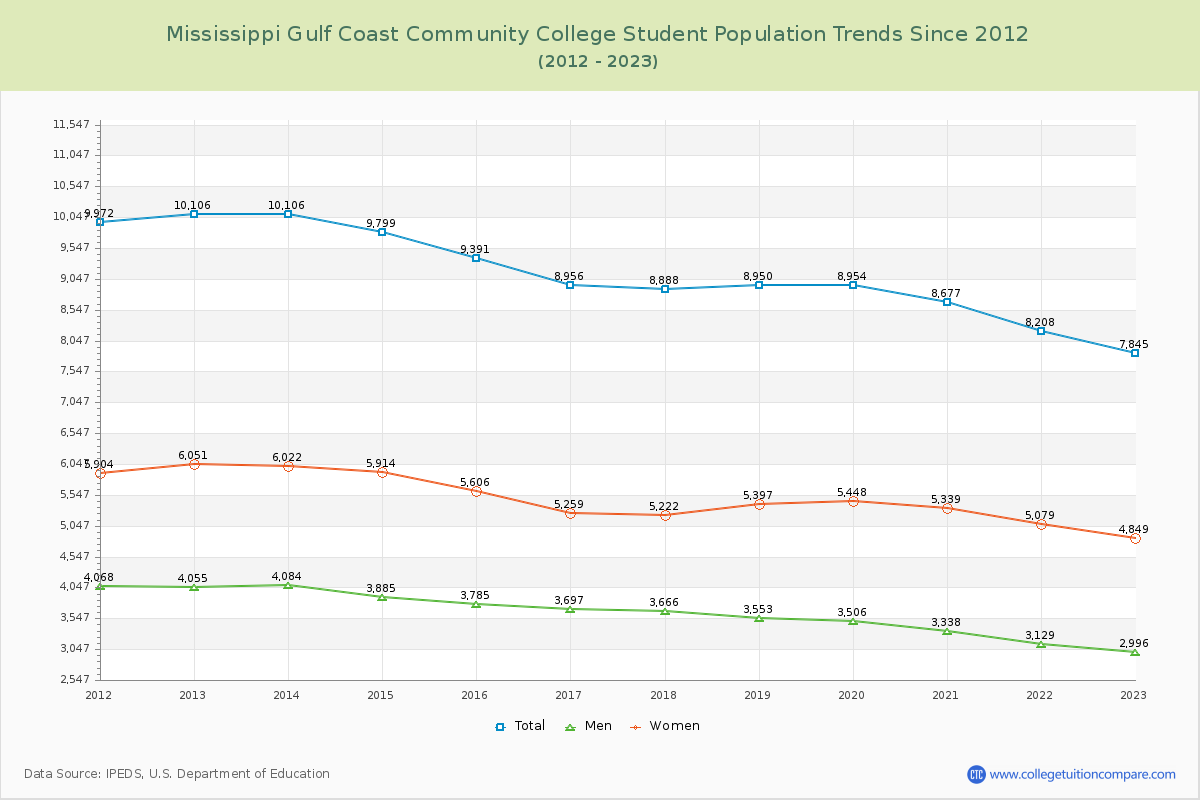
Student Population Changes
The average student population over the last 12 years is 9,080 where 7,845 students are attending the school for the academic year 2022-2023.
The female to male ratio is 1.62 to 1 and it means that there are more female students enrolled in Mississippi Gulf Coast CC than male students.
The following table and chart illustrate the changes in student population by gender at Mississippi Gulf Coast Community College since 2012.
| Year | Total | Men | Women |
|---|---|---|---|
| 2012-13 | 10,106 | 4,055 | 6,051 |
| 2013-14 | 10,106 0 | 4,084 29 | 6,022 -29 |
| 2014-15 | 9,799 -307 | 3,885 -199 | 5,914 -108 |
| 2015-16 | 9,391 -408 | 3,785 -100 | 5,606 -308 |
| 2016-17 | 8,956 -435 | 3,697 -88 | 5,259 -347 |
| 2017-18 | 8,888 -68 | 3,666 -31 | 5,222 -37 |
| 2018-19 | 8,950 62 | 3,553 -113 | 5,397 175 |
| 2019-20 | 8,954 4 | 3,506 -47 | 5,448 51 |
| 2020-21 | 8,677 -277 | 3,338 -168 | 5,339 -109 |
| 2021-22 | 8,208 -469 | 3,129 -209 | 5,079 -260 |
| 2022-23 | 7,845 -363 | 2,996 -133 | 4,849 -230 |
| Average | 9,080 | 3,609 | 5,471 |