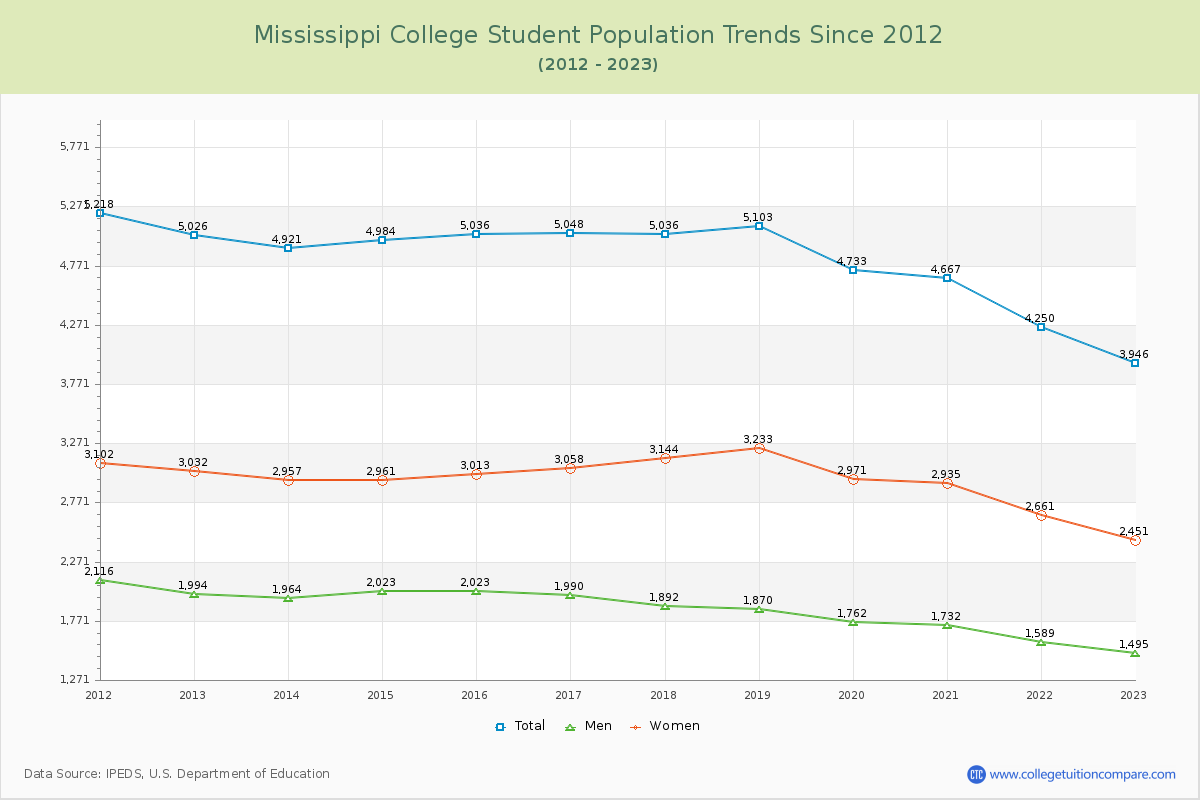
Student Population Changes
The average student population over the last 12 years is 4,795 where 3,946 students are attending the school for the academic year 2022-2023.
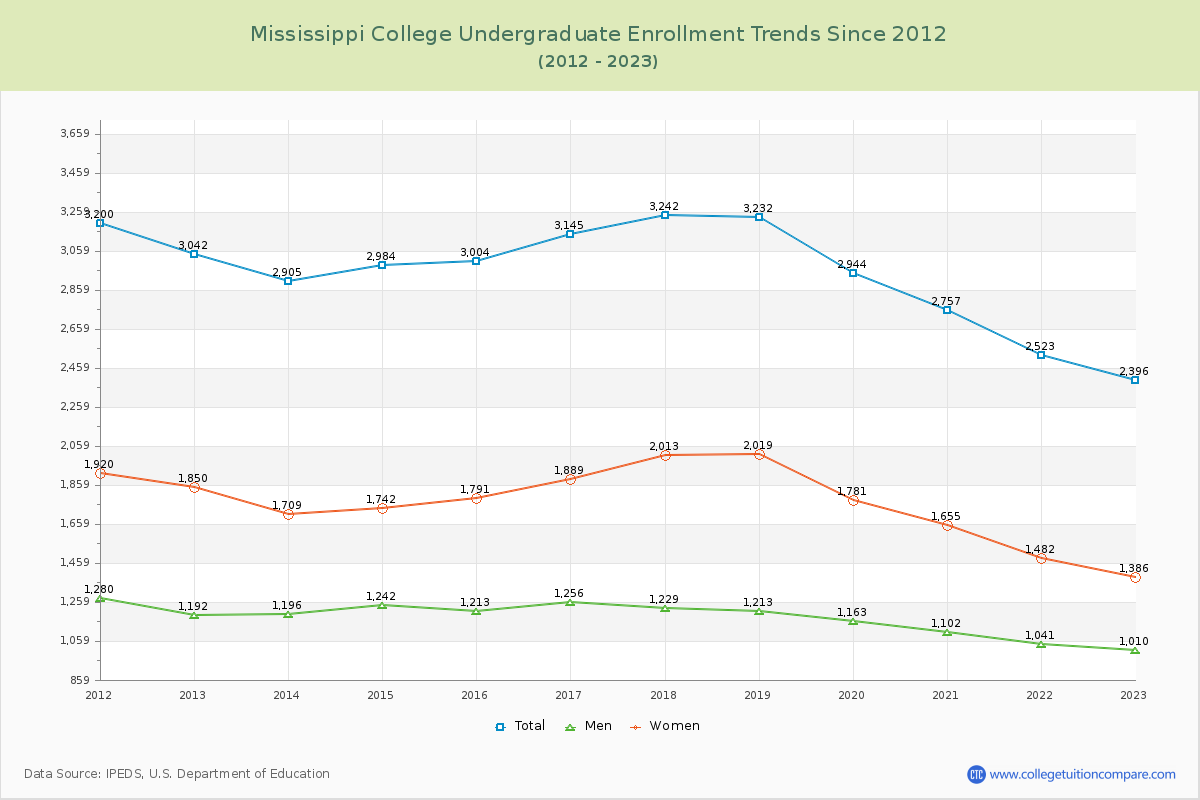
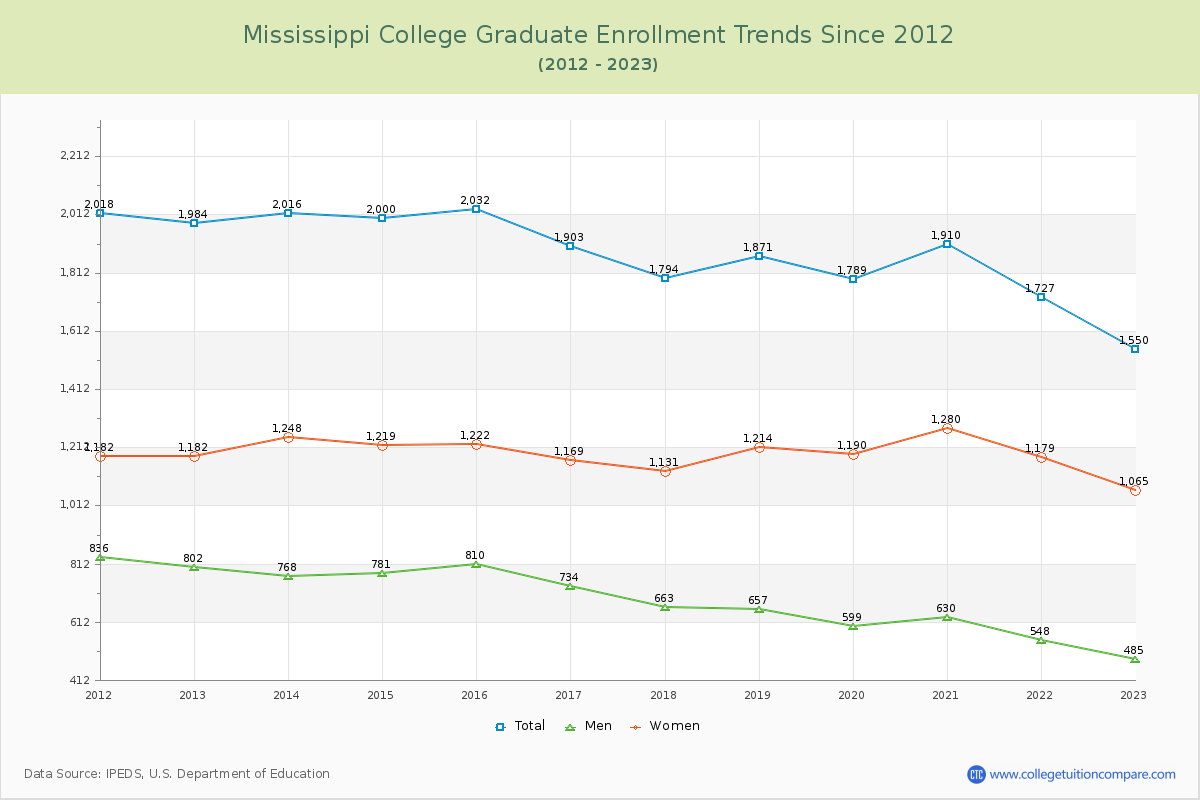
60.72% of total students is undergraduate students and 39.28% students is graduate students. The number of undergraduate students has decreased by 646 and the graduate enrollment has decreased by 434 over past 10 years.
The female to male ratio is 1.64 to 1 and it means that there are more female students enrolled in MC than male students.
The following table and chart illustrate the changes in student population by gender at Mississippi College since 2012.
| Year | Total | Undergraduate | Graduate | ||||
|---|---|---|---|---|---|---|---|
| Total | Men | Women | Total | Men | Women | ||
| 2012-13 | 5,026 | 3,042 | 1,192 | 1,850 | 1,984 | 802 | 1,182 |
| 2013-14 | 4,921 -105 | 2,905 -137 | 1,196 4 | 1,709 -141 | 2,016 32 | 768 -34 | 1,248 66 |
| 2014-15 | 4,984 63 | 2,984 79 | 1,242 46 | 1,742 33 | 2,000 -16 | 781 13 | 1,219 -29 |
| 2015-16 | 5,036 52 | 3,004 20 | 1,213 -29 | 1,791 49 | 2,032 32 | 810 29 | 1,222 3 |
| 2016-17 | 5,048 12 | 3,145 141 | 1,256 43 | 1,889 98 | 1,903 -129 | 734 -76 | 1,169 -53 |
| 2017-18 | 5,036 -12 | 3,242 97 | 1,229 -27 | 2,013 124 | 1,794 -109 | 663 -71 | 1,131 -38 |
| 2018-19 | 5,103 67 | 3,232 -10 | 1,213 -16 | 2,019 6 | 1,871 77 | 657 -6 | 1,214 83 |
| 2019-20 | 4,733 -370 | 2,944 -288 | 1,163 -50 | 1,781 -238 | 1,789 -82 | 599 -58 | 1,190 -24 |
| 2020-21 | 4,667 -66 | 2,757 -187 | 1,102 -61 | 1,655 -126 | 1,910 121 | 630 31 | 1,280 90 |
| 2021-22 | 4,250 -417 | 2,523 -234 | 1,041 -61 | 1,482 -173 | 1,727 -183 | 548 -82 | 1,179 -101 |
| 2022-23 | 3,946 -304 | 2,396 -127 | 1,010 -31 | 1,386 -96 | 1,550 -177 | 485 -63 | 1,065 -114 |
| Average | 4,795 | 2,925 | 1,169 | 1,756 | 1,871 | 680 | 1,191 |