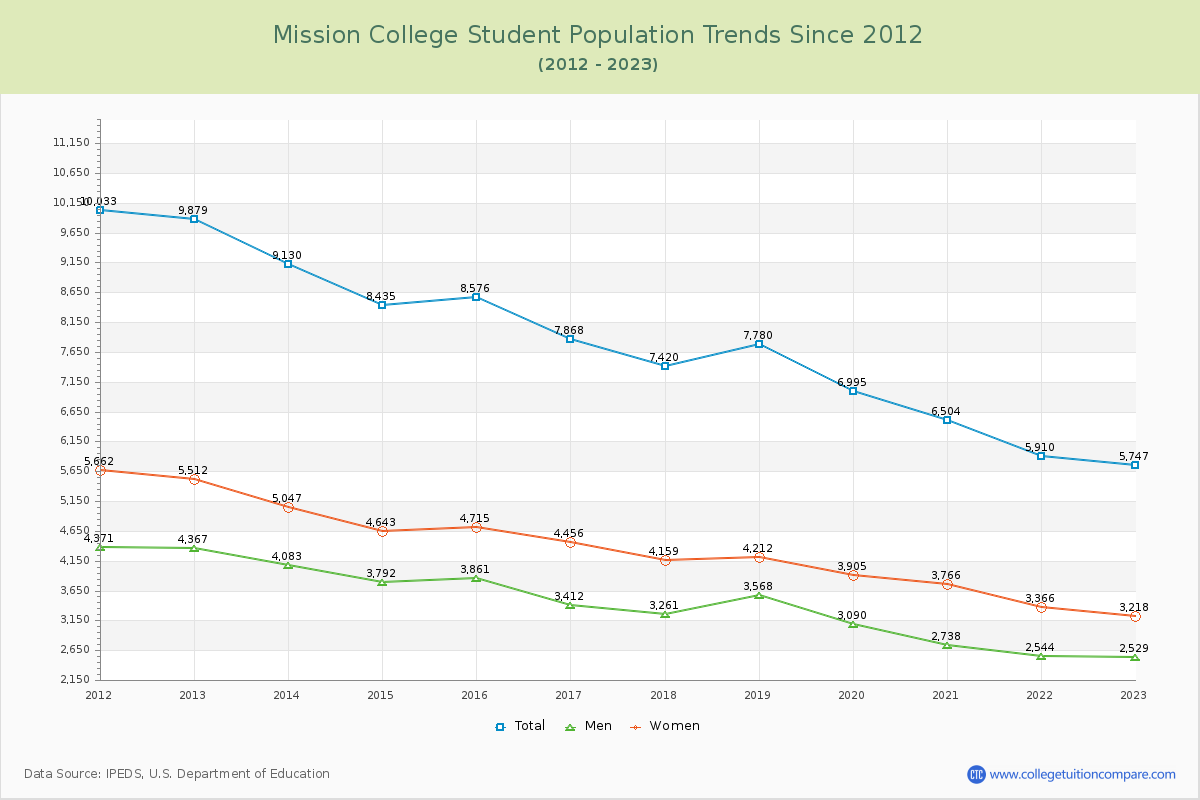
Student Population Changes
The average student population over the last 12 years is 7,659 where 5,747 students are attending the school for the academic year 2022-2023.
The female to male ratio is 1.27 to 1 and it means that there are slightly more female students enrolled in Mission than male students.
The following table and chart illustrate the changes in student population by gender at Mission College since 2012.
| Year | Total | Men | Women |
|---|---|---|---|
| 2012-13 | 9,879 | 4,367 | 5,512 |
| 2013-14 | 9,130 -749 | 4,083 -284 | 5,047 -465 |
| 2014-15 | 8,435 -695 | 3,792 -291 | 4,643 -404 |
| 2015-16 | 8,576 141 | 3,861 69 | 4,715 72 |
| 2016-17 | 7,868 -708 | 3,412 -449 | 4,456 -259 |
| 2017-18 | 7,420 -448 | 3,261 -151 | 4,159 -297 |
| 2018-19 | 7,780 360 | 3,568 307 | 4,212 53 |
| 2019-20 | 6,995 -785 | 3,090 -478 | 3,905 -307 |
| 2020-21 | 6,504 -491 | 2,738 -352 | 3,766 -139 |
| 2021-22 | 5,910 -594 | 2,544 -194 | 3,366 -400 |
| 2022-23 | 5,747 -163 | 2,529 -15 | 3,218 -148 |
| Average | 7,659 | 3,386 | 4,273 |