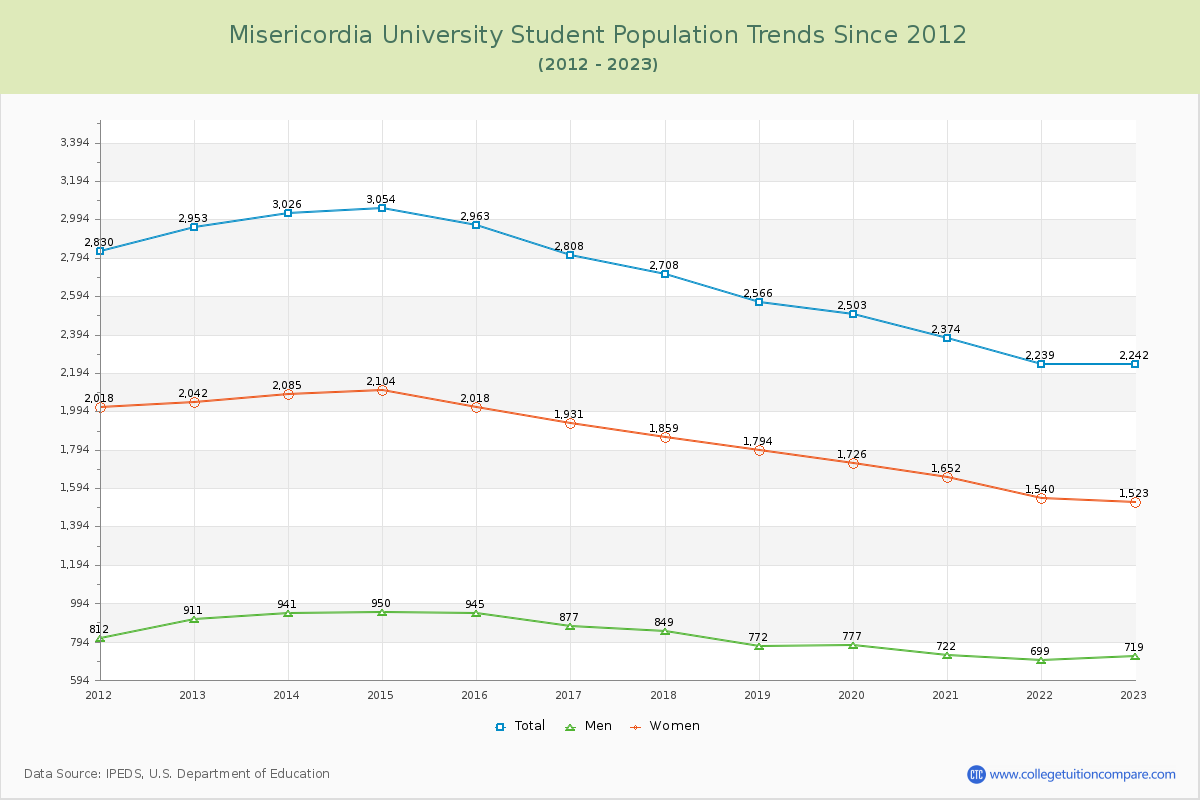
Student Population Changes
The average student population over the last 12 years is 2,676 where 2,242 students are attending the school for the academic year 2022-2023.
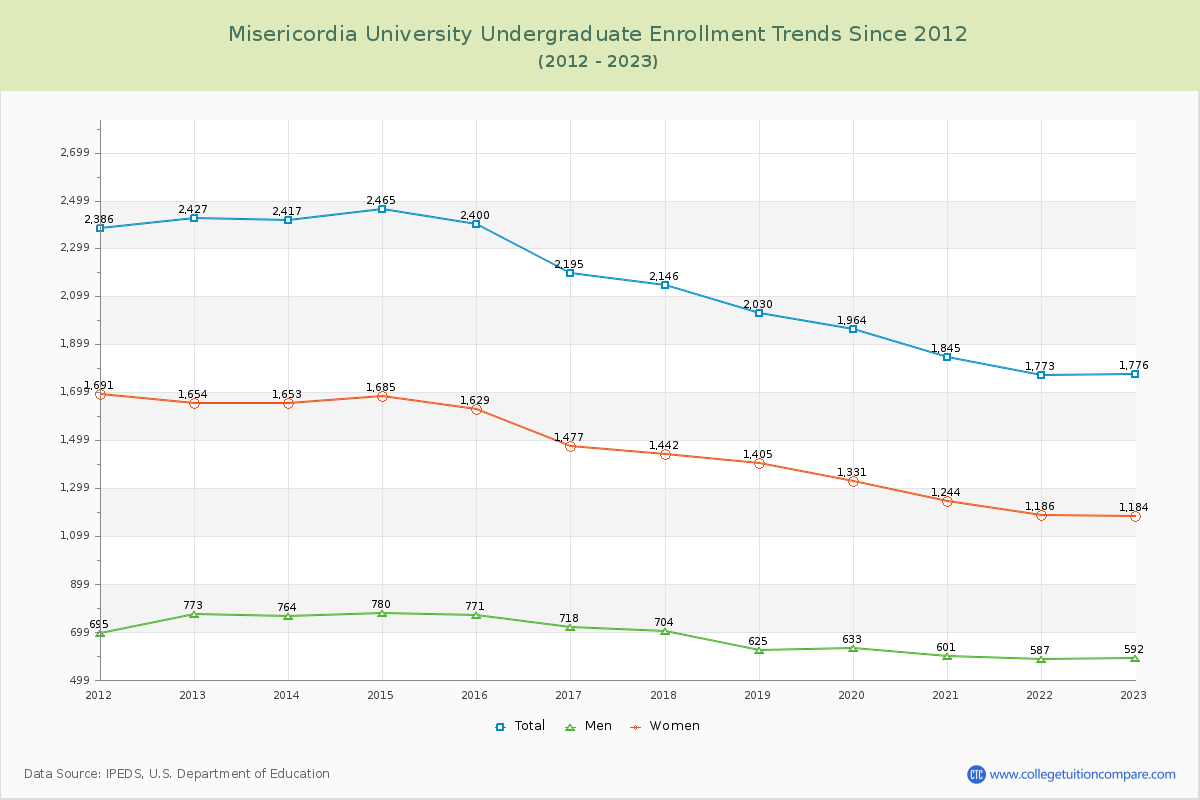
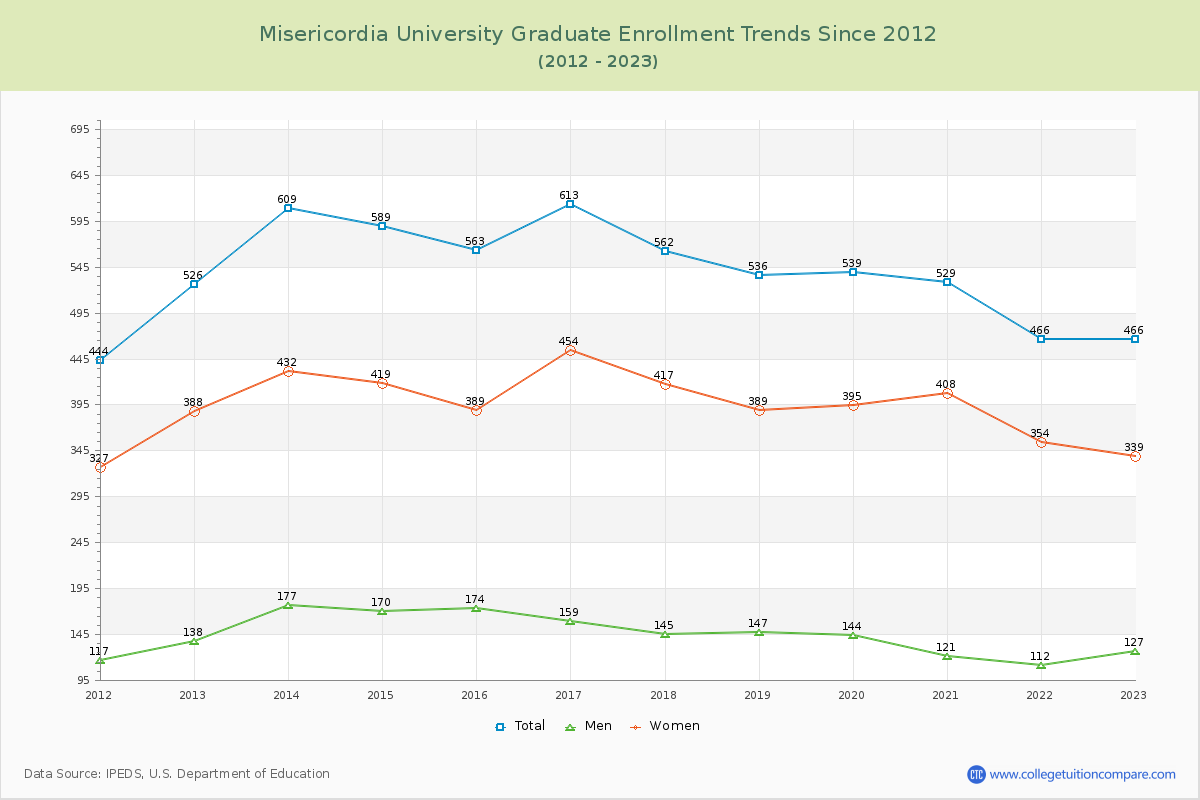
79.21% of total students is undergraduate students and 20.79% students is graduate students. The number of undergraduate students has decreased by 651 and the graduate enrollment has decreased by 60 over past 10 years.
The female to male ratio is 2.12 to 1 and it means that there are far more female students enrolled in Misericordia than male students.
The following table and chart illustrate the changes in student population by gender at Misericordia University since 2012.
| Year | Total | Undergraduate | Graduate | ||||
|---|---|---|---|---|---|---|---|
| Total | Men | Women | Total | Men | Women | ||
| 2012-13 | 2,953 | 2,427 | 773 | 1,654 | 526 | 138 | 388 |
| 2013-14 | 3,026 73 | 2,417 -10 | 764 -9 | 1,653 -1 | 609 83 | 177 39 | 432 44 |
| 2014-15 | 3,054 28 | 2,465 48 | 780 16 | 1,685 32 | 589 -20 | 170 -7 | 419 -13 |
| 2015-16 | 2,963 -91 | 2,400 -65 | 771 -9 | 1,629 -56 | 563 -26 | 174 4 | 389 -30 |
| 2016-17 | 2,808 -155 | 2,195 -205 | 718 -53 | 1,477 -152 | 613 50 | 159 -15 | 454 65 |
| 2017-18 | 2,708 -100 | 2,146 -49 | 704 -14 | 1,442 -35 | 562 -51 | 145 -14 | 417 -37 |
| 2018-19 | 2,566 -142 | 2,030 -116 | 625 -79 | 1,405 -37 | 536 -26 | 147 2 | 389 -28 |
| 2019-20 | 2,503 -63 | 1,964 -66 | 633 8 | 1,331 -74 | 539 3 | 144 -3 | 395 6 |
| 2020-21 | 2,374 -129 | 1,845 -119 | 601 -32 | 1,244 -87 | 529 -10 | 121 -23 | 408 13 |
| 2021-22 | 2,239 -135 | 1,773 -72 | 587 -14 | 1,186 -58 | 466 -63 | 112 -9 | 354 -54 |
| 2022-23 | 2,242 3 | 1,776 3 | 592 5 | 1,184 -2 | 466 0 | 127 15 | 339 -15 |
| Average | 2,676 | 2,131 | 686 | 1,445 | 545 | 147 | 399 |