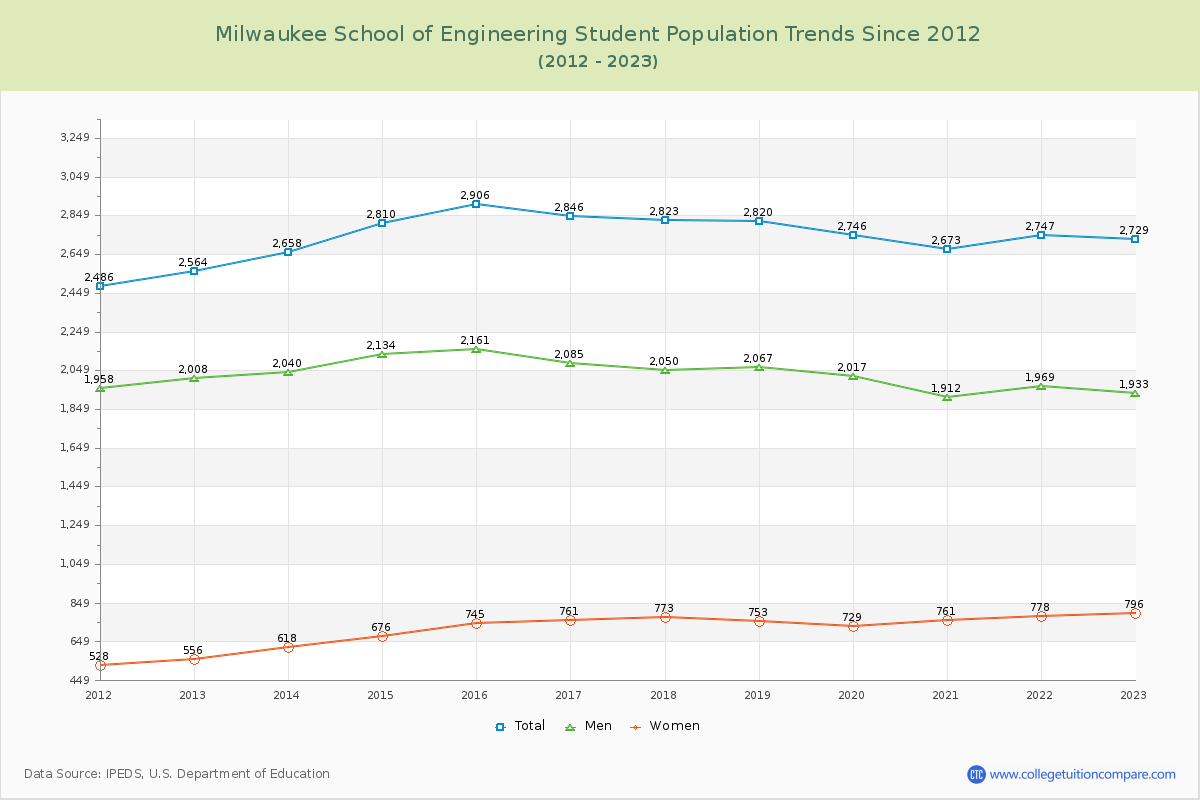
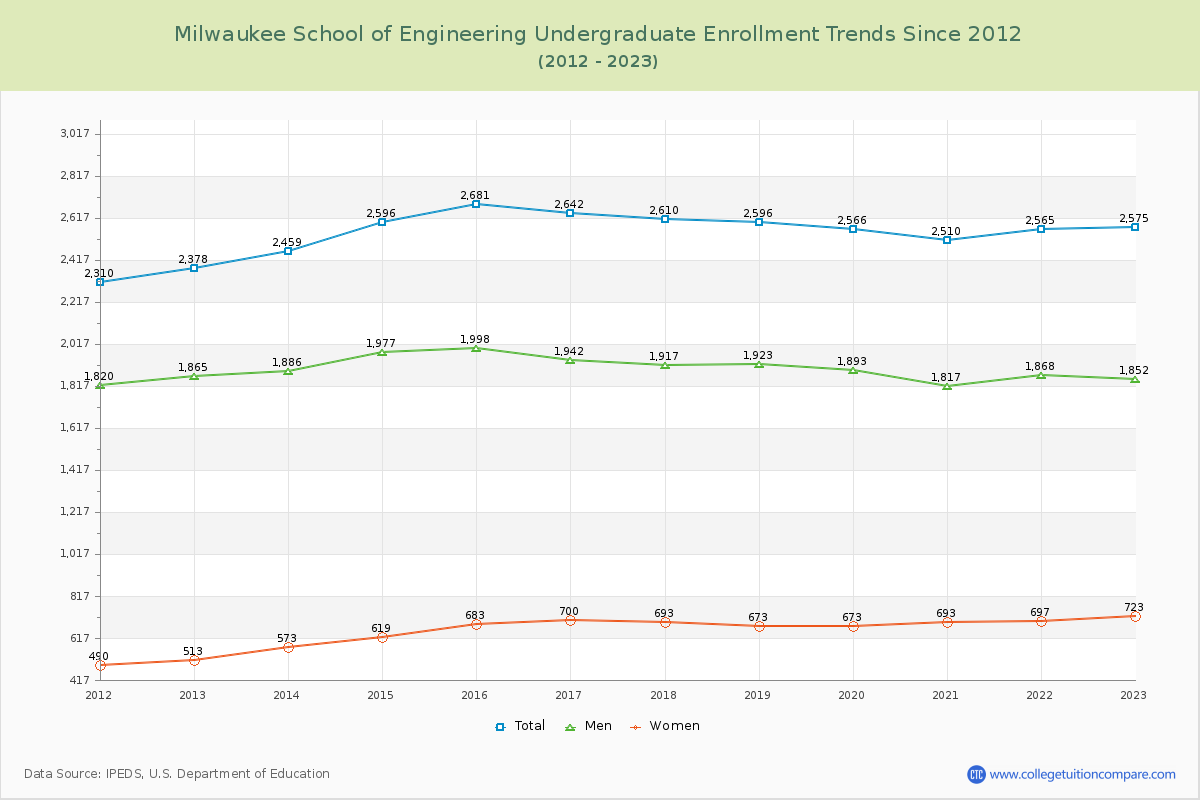
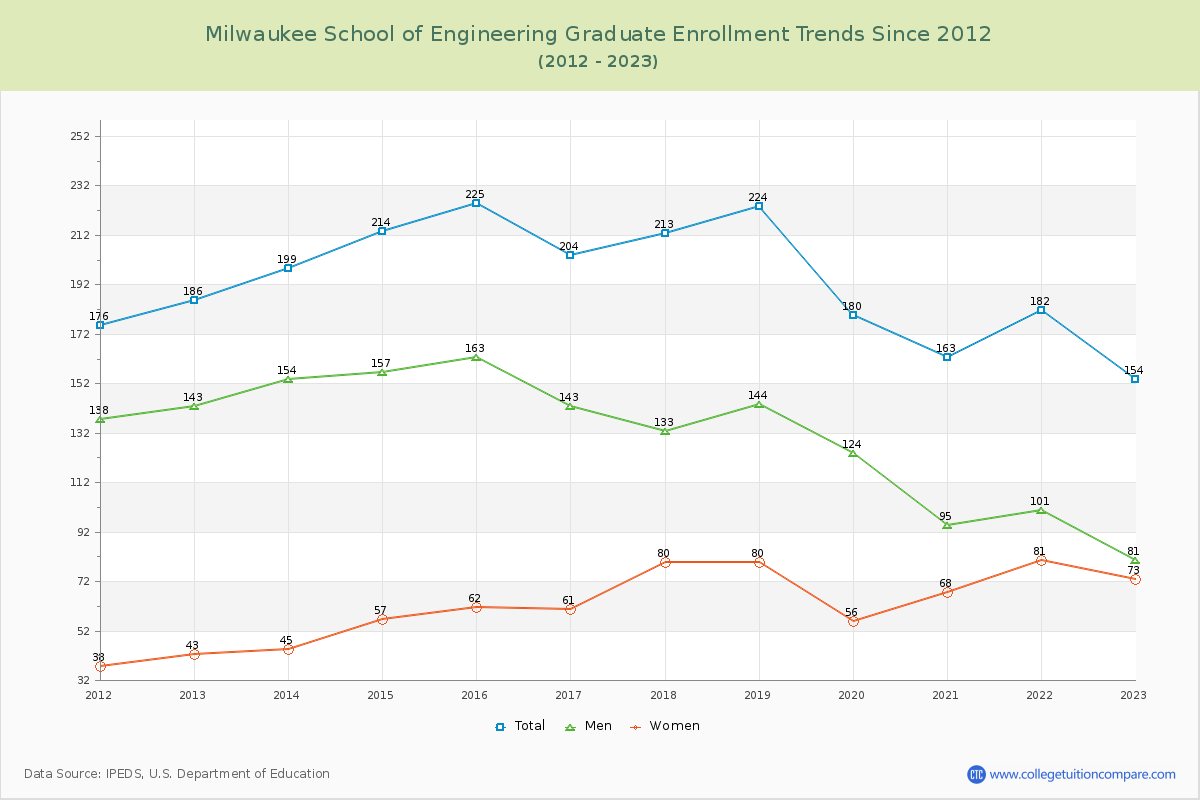
Student Population Changes
The average student population over the last 12 years is 2,757 where 2,729 students are attending the school for the academic year 2022-2023.
94.36% of total students is undergraduate students and 5.64% students is graduate students. The number of undergraduate students has increased by 197 and the graduate enrollment has decreased by 32 over past 10 years.
The female to male ratio is 0.41 to 1 and it means that there are far more male students enrolled in MSOE than female students.
The following table and chart illustrate the changes in student population by gender at Milwaukee School of Engineering since 2012.
| Year | Total | Undergraduate | Graduate | ||||
|---|---|---|---|---|---|---|---|
| Total | Men | Women | Total | Men | Women | ||
| 2012-13 | 2,564 | 2,378 | 1,865 | 513 | 186 | 143 | 43 |
| 2013-14 | 2,658 94 | 2,459 81 | 1,886 21 | 573 60 | 199 13 | 154 11 | 45 2 |
| 2014-15 | 2,810 152 | 2,596 137 | 1,977 91 | 619 46 | 214 15 | 157 3 | 57 12 |
| 2015-16 | 2,906 96 | 2,681 85 | 1,998 21 | 683 64 | 225 11 | 163 6 | 62 5 |
| 2016-17 | 2,846 -60 | 2,642 -39 | 1,942 -56 | 700 17 | 204 -21 | 143 -20 | 61 -1 |
| 2017-18 | 2,823 -23 | 2,610 -32 | 1,917 -25 | 693 -7 | 213 9 | 133 -10 | 80 19 |
| 2018-19 | 2,820 -3 | 2,596 -14 | 1,923 6 | 673 -20 | 224 11 | 144 11 | 80 0 |
| 2019-20 | 2,746 -74 | 2,566 -30 | 1,893 -30 | 673 0 | 180 -44 | 124 -20 | 56 -24 |
| 2020-21 | 2,673 -73 | 2,510 -56 | 1,817 -76 | 693 20 | 163 -17 | 95 -29 | 68 12 |
| 2021-22 | 2,747 74 | 2,565 55 | 1,868 51 | 697 4 | 182 19 | 101 6 | 81 13 |
| 2022-23 | 2,729 -18 | 2,575 10 | 1,852 -16 | 723 26 | 154 -28 | 81 -20 | 73 -8 |
| Average | 2,757 | 2,562 | 1,903 | 658 | 195 | 131 | 64 |