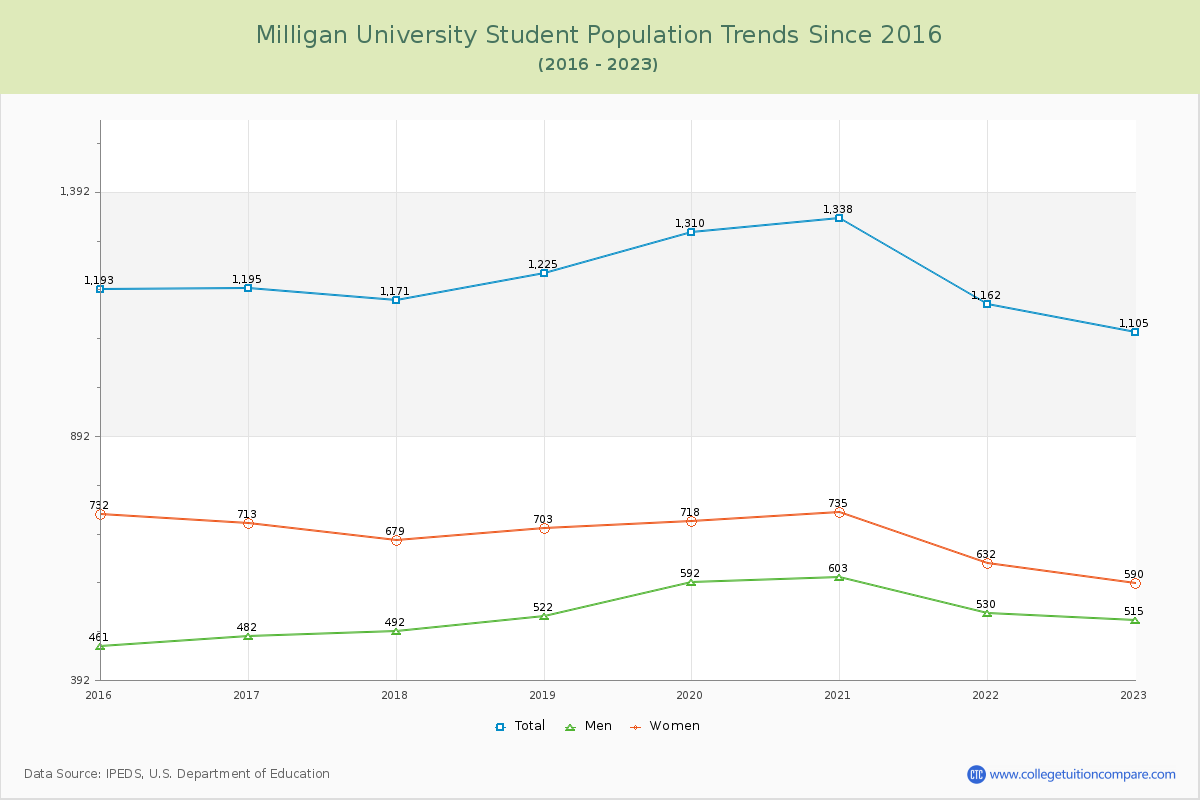
Student Population Changes
The average student population over the last 9 years is 1,212 where 1,105 students are attending the school for the academic year 2022-2023.
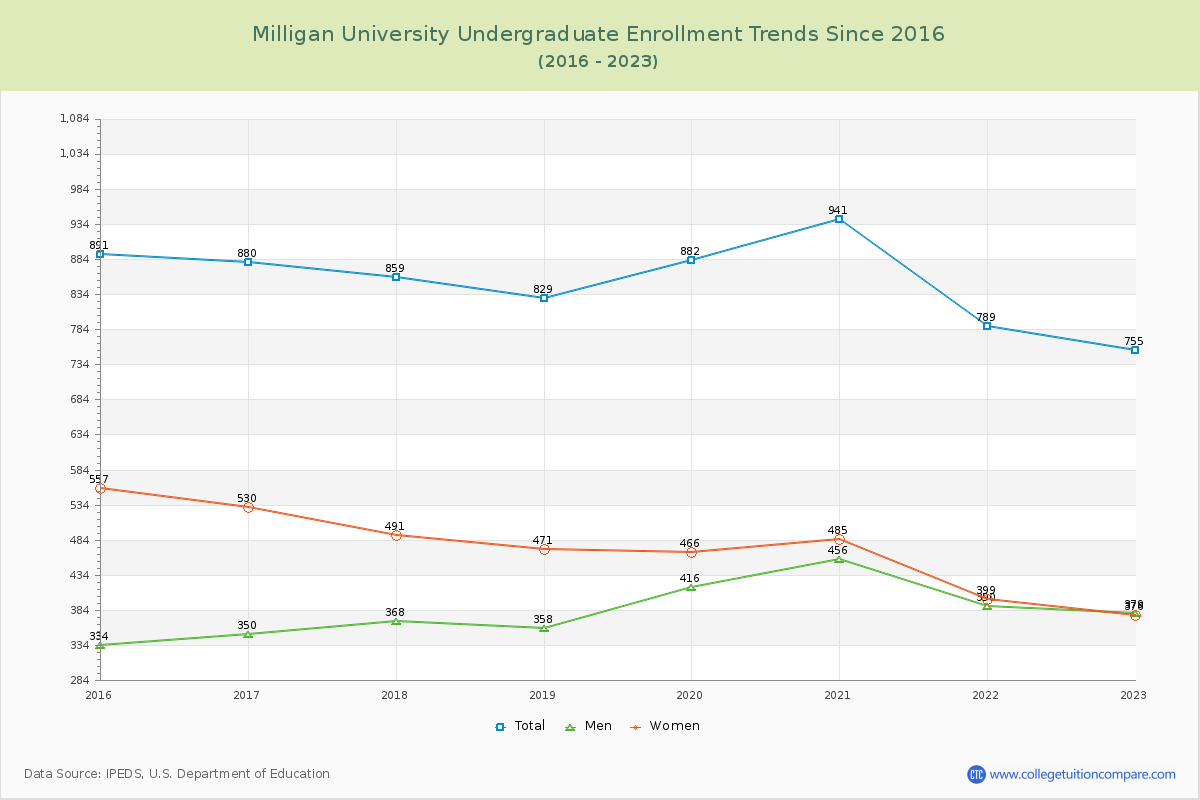
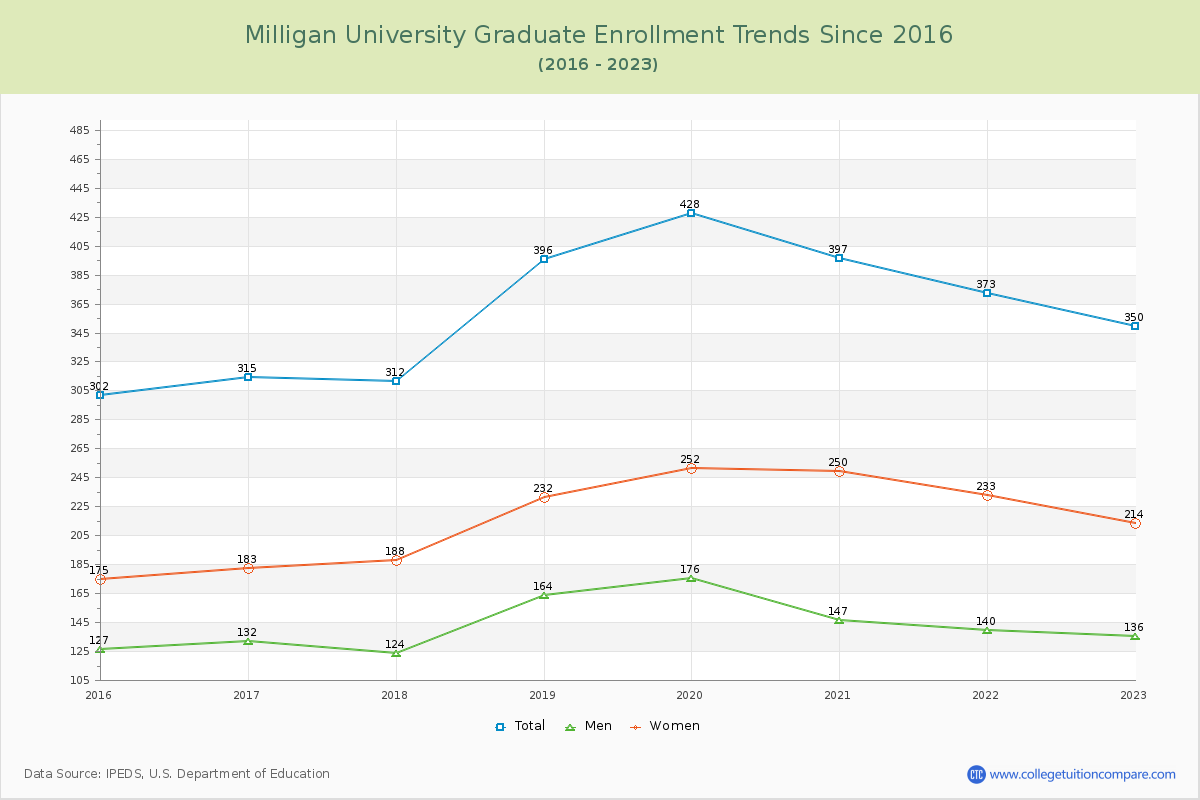
68.33% of total students is undergraduate students and 31.67% students is graduate students. The number of undergraduate students has decreased by 136 and the graduate enrollment has increased by 48 over past 10 years.
The female to male ratio is 1.15 to 1 and it means that there are slightly more female students enrolled in Milligan than male students.
The following table and chart illustrate the changes in student population by gender at Milligan University since 2015.
| Year | Total | Undergraduate | Graduate | ||||
|---|---|---|---|---|---|---|---|
| Total | Men | Women | Total | Men | Women | ||
| 2015-16 | 1,193 | 891 | 334 | 557 | 302 | 127 | 175 |
| 2016-17 | 1,195 2 | 880 -11 | 350 16 | 530 -27 | 315 13 | 132 5 | 183 8 |
| 2017-18 | 1,171 -24 | 859 -21 | 368 18 | 491 -39 | 312 -3 | 124 -8 | 188 5 |
| 2018-19 | 1,225 54 | 829 -30 | 358 -10 | 471 -20 | 396 84 | 164 40 | 232 44 |
| 2019-20 | 1,310 85 | 882 53 | 416 58 | 466 -5 | 428 32 | 176 12 | 252 20 |
| 2020-21 | 1,338 28 | 941 59 | 456 40 | 485 19 | 397 -31 | 147 -29 | 250 -2 |
| 2021-22 | 1,162 -176 | 789 -152 | 390 -66 | 399 -86 | 373 -24 | 140 -7 | 233 -17 |
| 2022-23 | 1,105 -57 | 755 -34 | 379 -11 | 376 -23 | 350 -23 | 136 -4 | 214 -19 |
| Average | 1,212 | 853 | 381 | 472 | 359 | 143 | 216 |