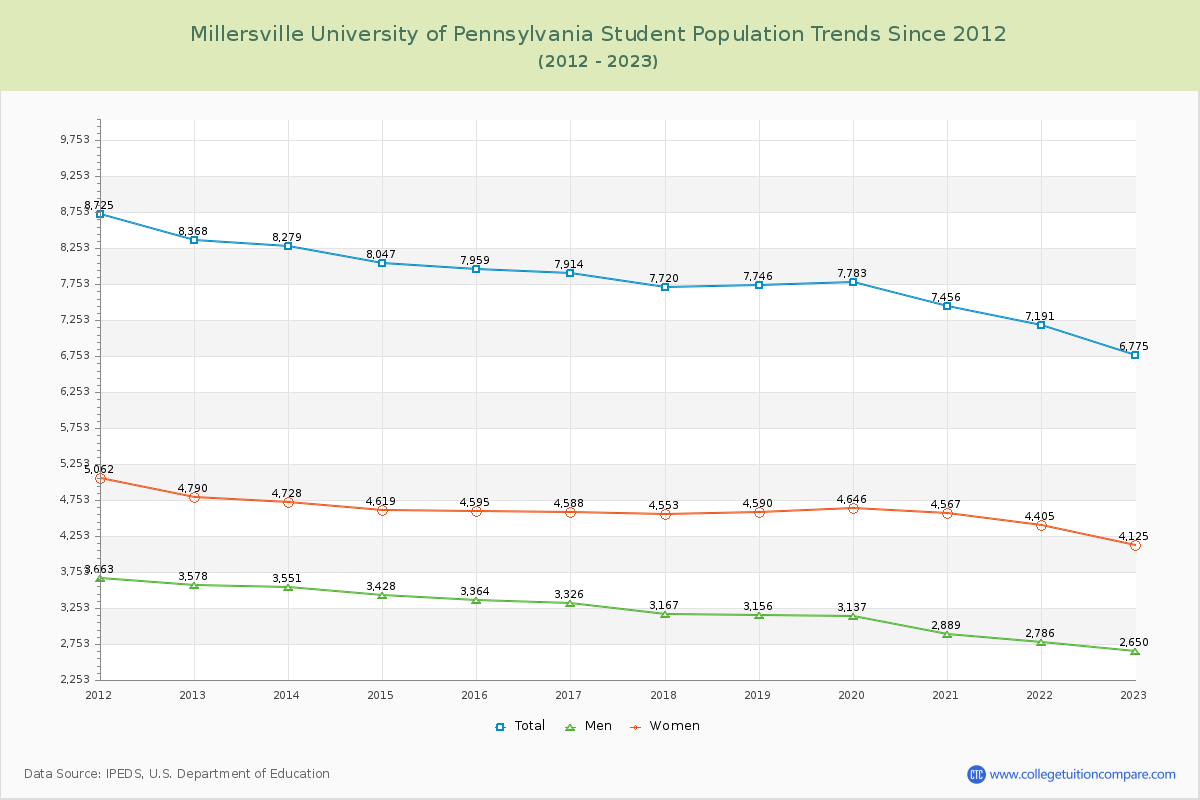
Student Population Changes
The average student population over the last 12 years is 7,749 where 6,775 students are attending the school for the academic year 2022-2023.
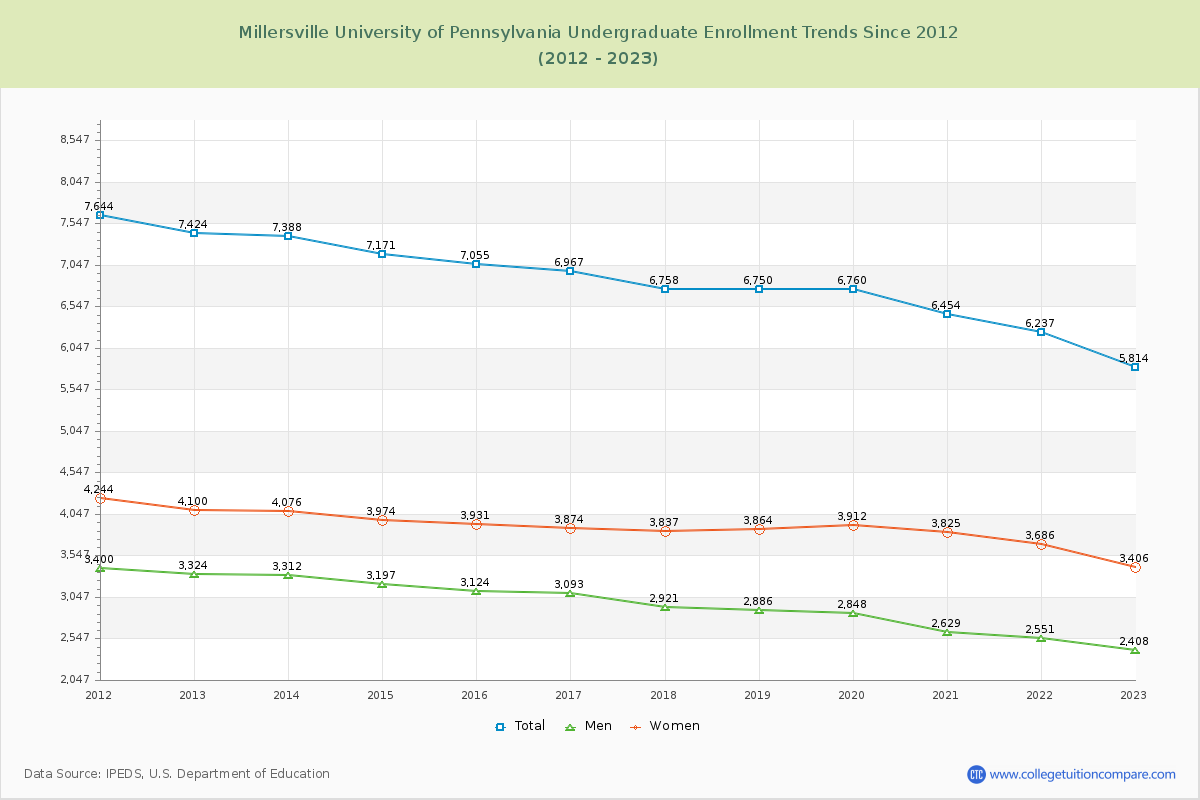
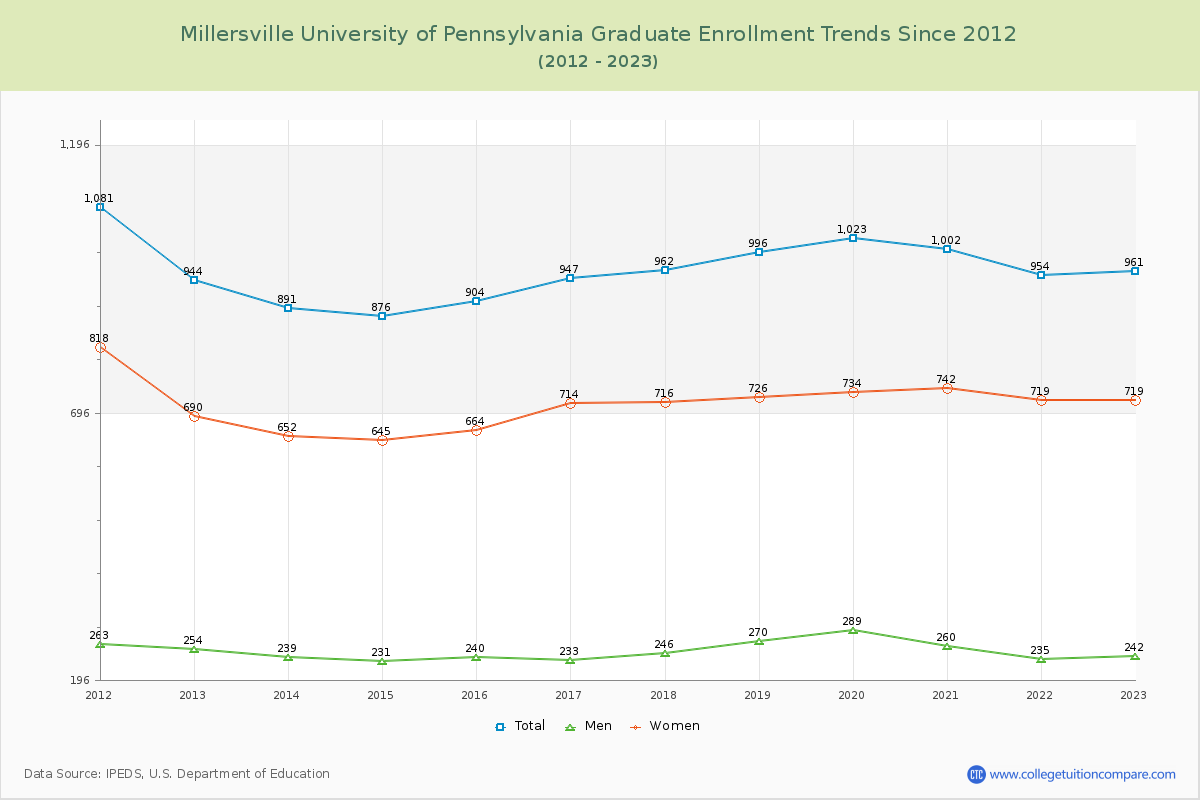
85.82% of total students is undergraduate students and 14.18% students is graduate students. The number of undergraduate students has decreased by 1,610 and the graduate enrollment has increased by 17 over past 10 years.
The female to male ratio is 1.56 to 1 and it means that there are more female students enrolled in Millersville University of Pennsylvania than male students.
The following table and chart illustrate the changes in student population by gender at Millersville University of Pennsylvania since 2012.
| Year | Total | Undergraduate | Graduate | ||||
|---|---|---|---|---|---|---|---|
| Total | Men | Women | Total | Men | Women | ||
| 2012-13 | 8,368 | 7,424 | 3,324 | 4,100 | 944 | 254 | 690 |
| 2013-14 | 8,279 -89 | 7,388 -36 | 3,312 -12 | 4,076 -24 | 891 -53 | 239 -15 | 652 -38 |
| 2014-15 | 8,047 -232 | 7,171 -217 | 3,197 -115 | 3,974 -102 | 876 -15 | 231 -8 | 645 -7 |
| 2015-16 | 7,959 -88 | 7,055 -116 | 3,124 -73 | 3,931 -43 | 904 28 | 240 9 | 664 19 |
| 2016-17 | 7,914 -45 | 6,967 -88 | 3,093 -31 | 3,874 -57 | 947 43 | 233 -7 | 714 50 |
| 2017-18 | 7,720 -194 | 6,758 -209 | 2,921 -172 | 3,837 -37 | 962 15 | 246 13 | 716 2 |
| 2018-19 | 7,746 26 | 6,750 -8 | 2,886 -35 | 3,864 27 | 996 34 | 270 24 | 726 10 |
| 2019-20 | 7,783 37 | 6,760 10 | 2,848 -38 | 3,912 48 | 1,023 27 | 289 19 | 734 8 |
| 2020-21 | 7,456 -327 | 6,454 -306 | 2,629 -219 | 3,825 -87 | 1,002 -21 | 260 -29 | 742 8 |
| 2021-22 | 7,191 -265 | 6,237 -217 | 2,551 -78 | 3,686 -139 | 954 -48 | 235 -25 | 719 -23 |
| 2022-23 | 6,775 -416 | 5,814 -423 | 2,408 -143 | 3,406 -280 | 961 7 | 242 7 | 719 0 |
| Average | 7,749 | 6,798 | 2,936 | 3,862 | 951 | 249 | 702 |