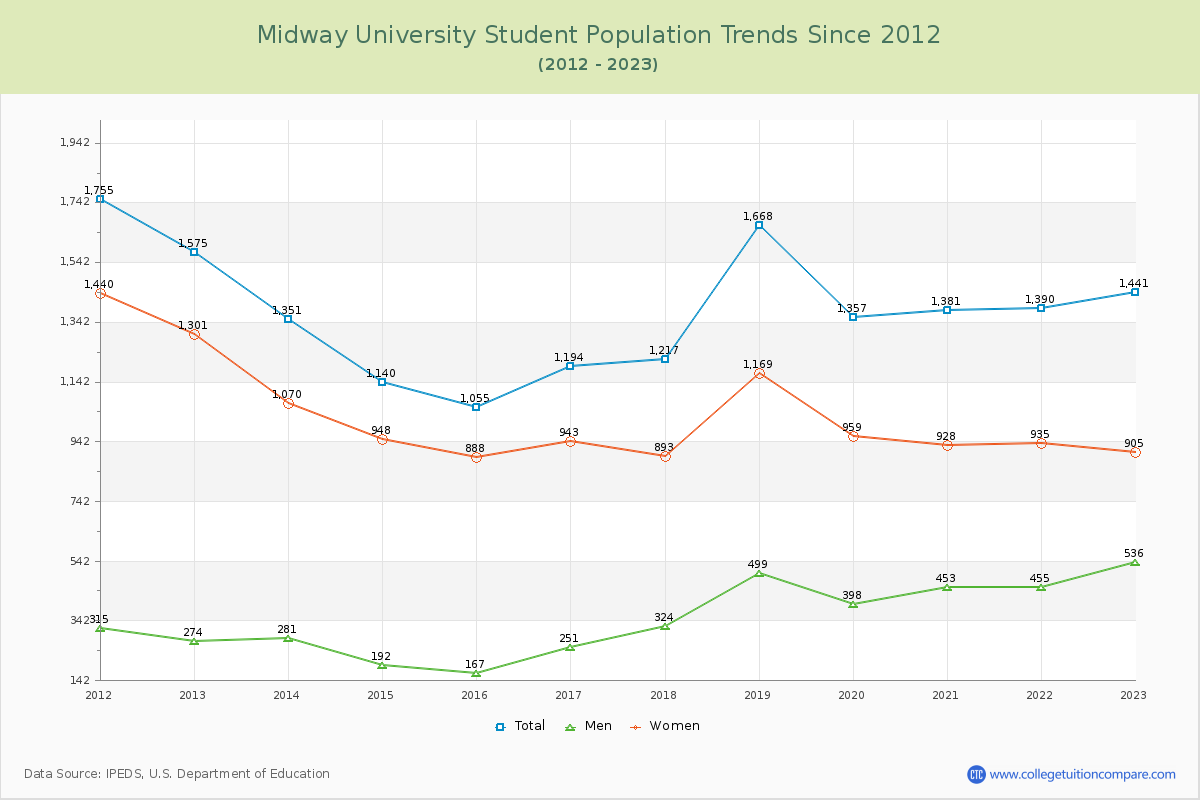
Student Population Changes
The average student population over the last 12 years is 1,343 where 1,441 students are attending the school for the academic year 2022-2023.
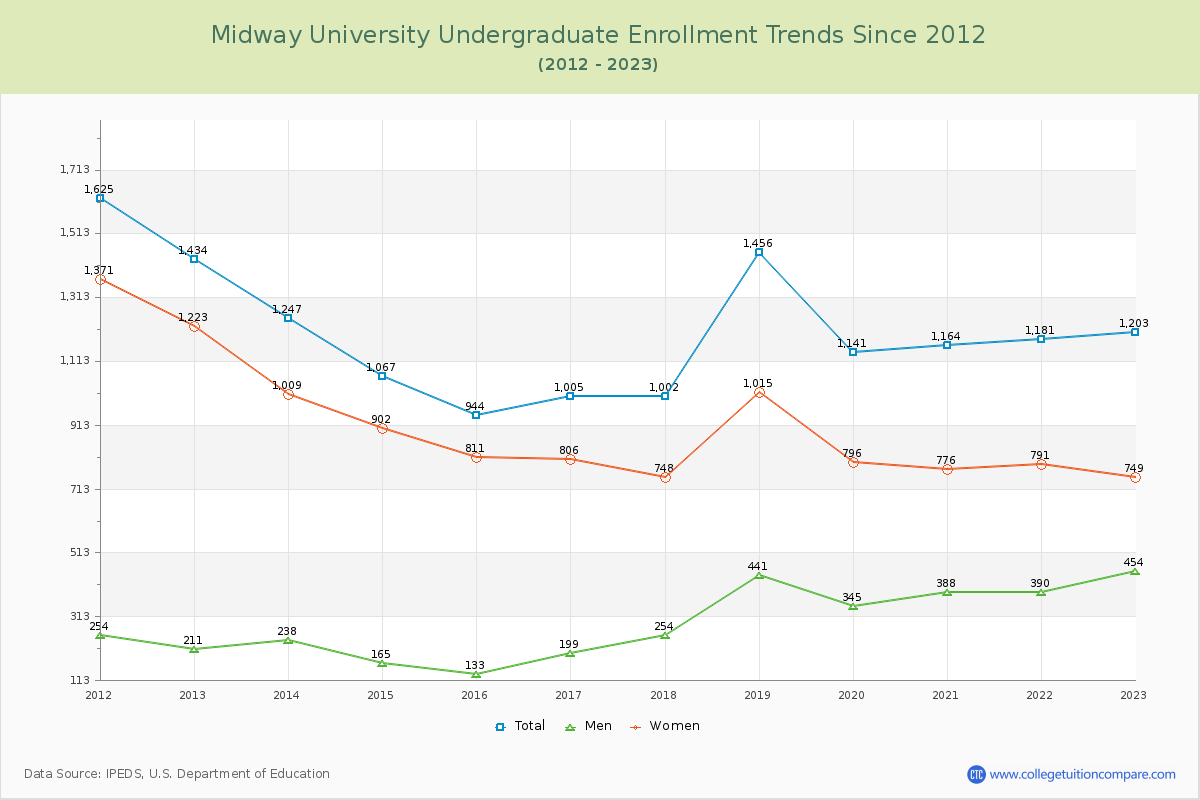
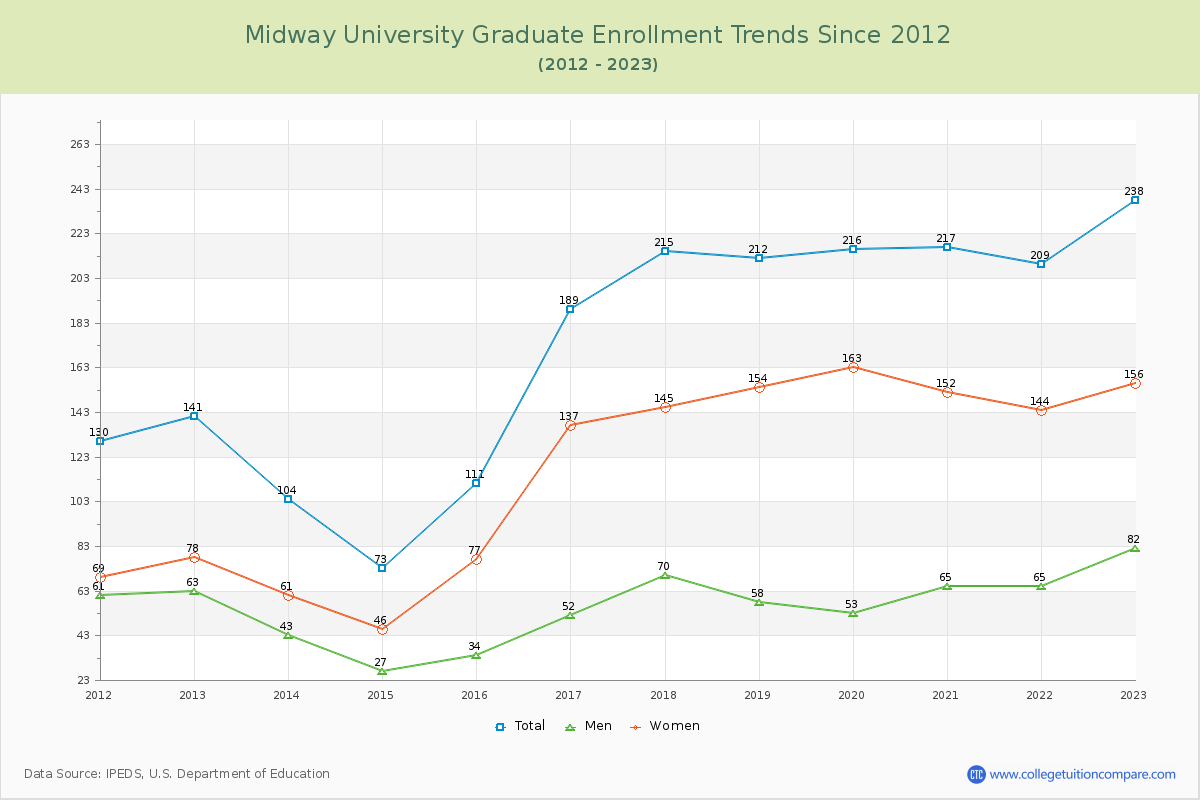
83.48% of total students is undergraduate students and 16.52% students is graduate students. The number of undergraduate students has decreased by 231 and the graduate enrollment has increased by 97 over past 10 years.
The female to male ratio is 1.69 to 1 and it means that there are more female students enrolled in Midway than male students.
The following table and chart illustrate the changes in student population by gender at Midway University since 2012.
| Year | Total | Undergraduate | Graduate | ||||
|---|---|---|---|---|---|---|---|
| Total | Men | Women | Total | Men | Women | ||
| 2012-13 | 1,575 | 1,434 | 211 | 1,223 | 141 | 63 | 78 |
| 2013-14 | 1,351 -224 | 1,247 -187 | 238 27 | 1,009 -214 | 104 -37 | 43 -20 | 61 -17 |
| 2014-15 | 1,140 -211 | 1,067 -180 | 165 -73 | 902 -107 | 73 -31 | 27 -16 | 46 -15 |
| 2015-16 | 1,055 -85 | 944 -123 | 133 -32 | 811 -91 | 111 38 | 34 7 | 77 31 |
| 2016-17 | 1,194 139 | 1,005 61 | 199 66 | 806 -5 | 189 78 | 52 18 | 137 60 |
| 2017-18 | 1,217 23 | 1,002 -3 | 254 55 | 748 -58 | 215 26 | 70 18 | 145 8 |
| 2018-19 | 1,668 451 | 1,456 454 | 441 187 | 1,015 267 | 212 -3 | 58 -12 | 154 9 |
| 2019-20 | 1,357 -311 | 1,141 -315 | 345 -96 | 796 -219 | 216 4 | 53 -5 | 163 9 |
| 2020-21 | 1,381 24 | 1,164 23 | 388 43 | 776 -20 | 217 1 | 65 12 | 152 -11 |
| 2021-22 | 1,390 9 | 1,181 17 | 390 2 | 791 15 | 209 -8 | 65 0 | 144 -8 |
| 2022-23 | 1,441 51 | 1,203 22 | 454 64 | 749 -42 | 238 29 | 82 17 | 156 12 |
| Average | 1,343 | 1,168 | 293 | 875 | 175 | 56 | 119 |