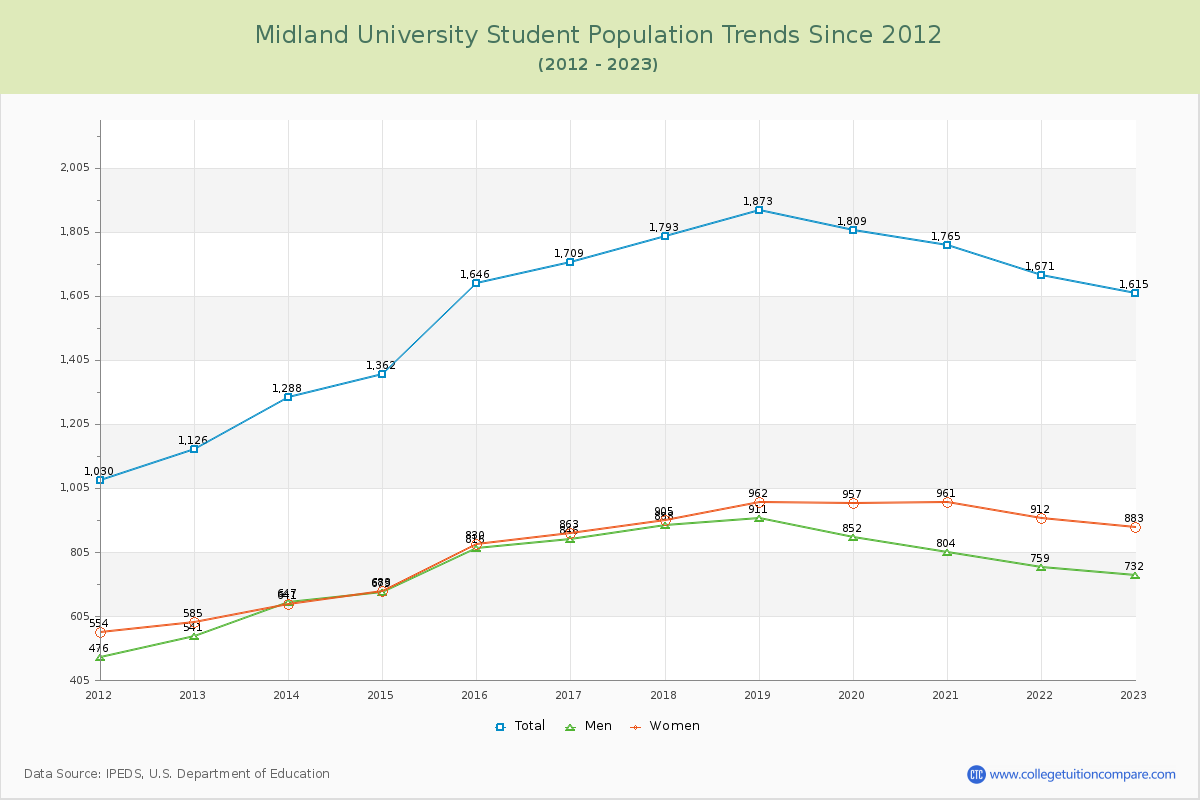
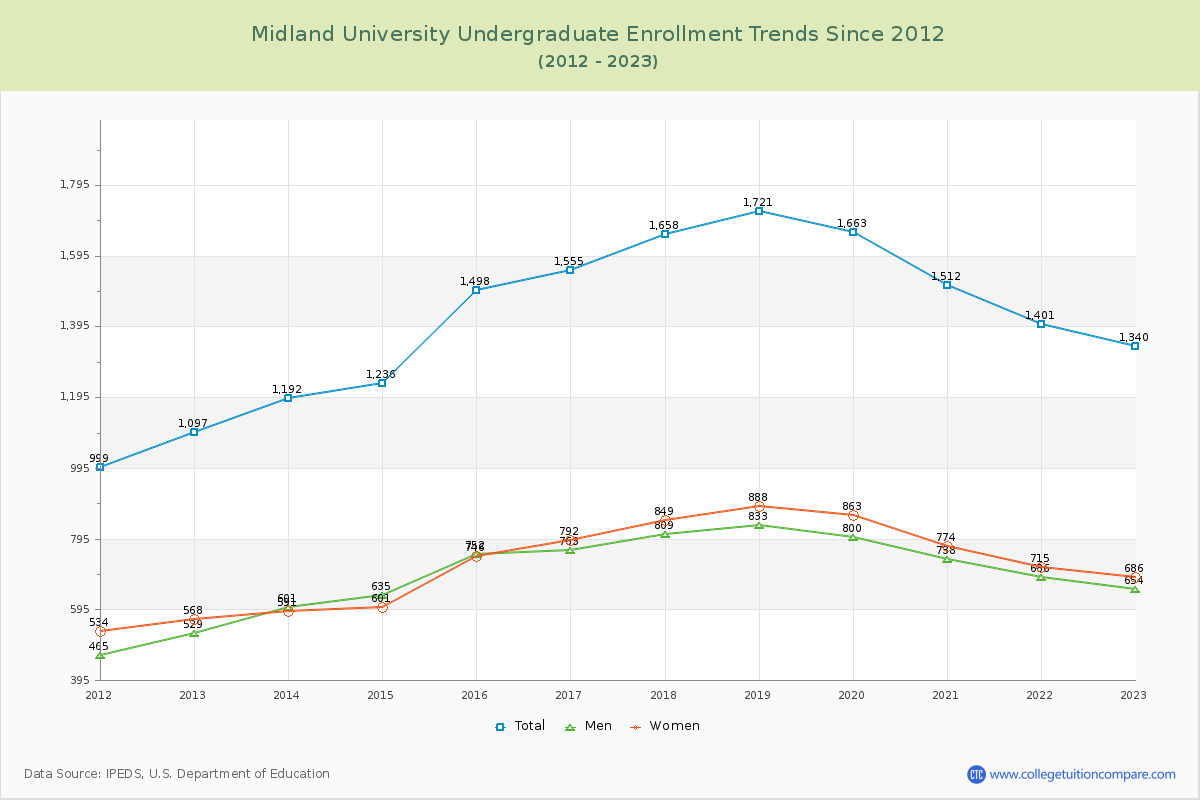
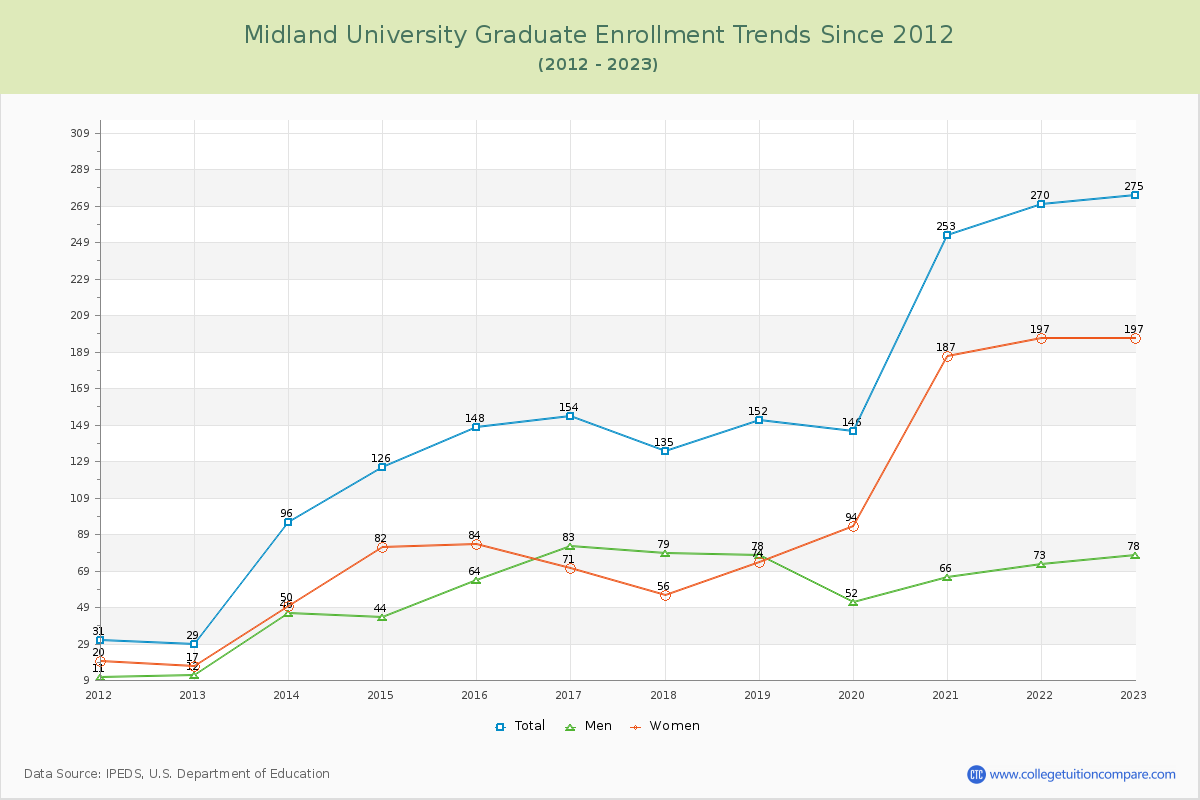
Student Population Changes
The average student population over the last 12 years is 1,605 where 1,615 students are attending the school for the academic year 2022-2023.
82.97% of total students is undergraduate students and 17.03% students is graduate students. The number of undergraduate students has increased by 243 and the graduate enrollment has increased by 246 over past 10 years.
The female to male ratio is 1.21 to 1 and it means that there are slightly more female students enrolled in Midland than male students.
The following table and chart illustrate the changes in student population by gender at Midland University since 2012.
| Year | Total | Undergraduate | Graduate | ||||
|---|---|---|---|---|---|---|---|
| Total | Men | Women | Total | Men | Women | ||
| 2012-13 | 1,126 | 1,097 | 529 | 568 | 29 | 12 | 17 |
| 2013-14 | 1,288 162 | 1,192 95 | 601 72 | 591 23 | 96 67 | 46 34 | 50 33 |
| 2014-15 | 1,362 74 | 1,236 44 | 635 34 | 601 10 | 126 30 | 44 -2 | 82 32 |
| 2015-16 | 1,646 284 | 1,498 262 | 752 117 | 746 145 | 148 22 | 64 20 | 84 2 |
| 2016-17 | 1,709 63 | 1,555 57 | 763 11 | 792 46 | 154 6 | 83 19 | 71 -13 |
| 2017-18 | 1,793 84 | 1,658 103 | 809 46 | 849 57 | 135 -19 | 79 -4 | 56 -15 |
| 2018-19 | 1,873 80 | 1,721 63 | 833 24 | 888 39 | 152 17 | 78 -1 | 74 18 |
| 2019-20 | 1,809 -64 | 1,663 -58 | 800 -33 | 863 -25 | 146 -6 | 52 -26 | 94 20 |
| 2020-21 | 1,765 -44 | 1,512 -151 | 738 -62 | 774 -89 | 253 107 | 66 14 | 187 93 |
| 2021-22 | 1,671 -94 | 1,401 -111 | 686 -52 | 715 -59 | 270 17 | 73 7 | 197 10 |
| 2022-23 | 1,615 -56 | 1,340 -61 | 654 -32 | 686 -29 | 275 5 | 78 5 | 197 0 |
| Average | 1,605 | 1,443 | 709 | 734 | 162 | 61 | 101 |