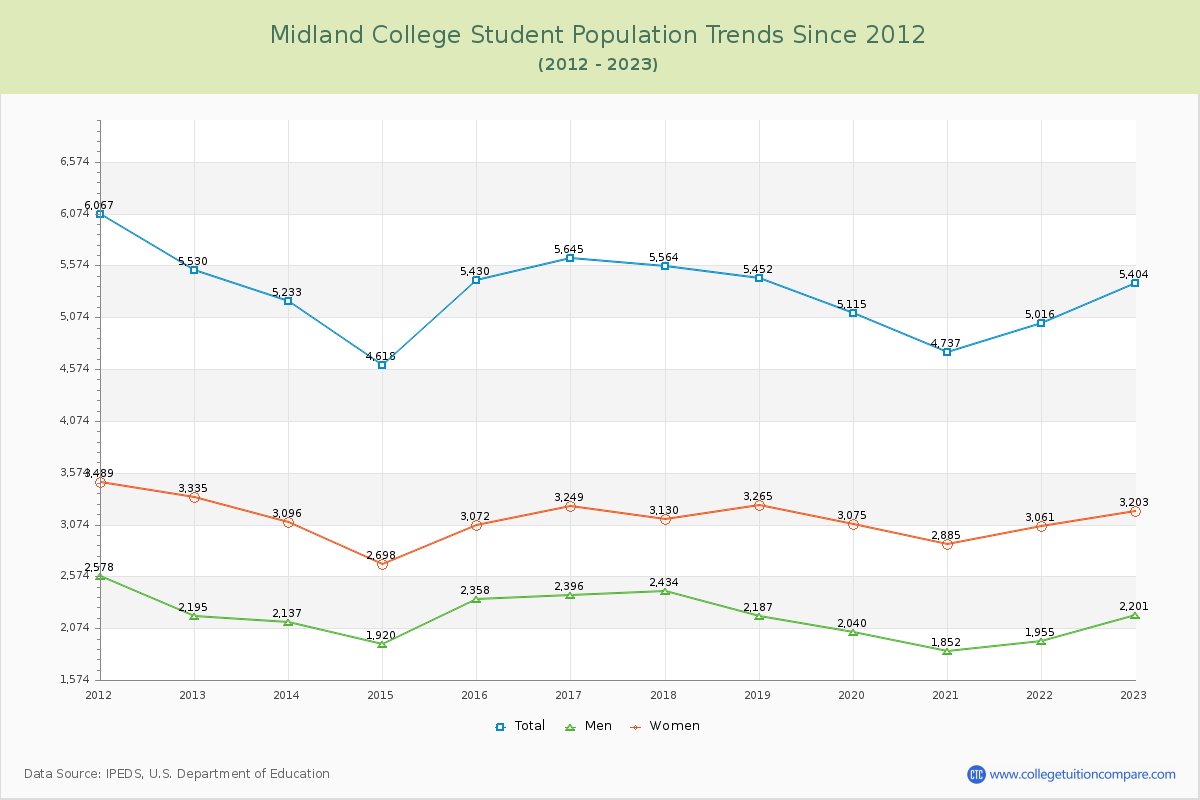
Student Population Changes
The average student population over the last 12 years is 5,249 where 5,404 students are attending the school for the academic year 2022-2023.
The female to male ratio is 1.46 to 1 and it means that there are more female students enrolled in Midland than male students.
The following table and chart illustrate the changes in student population by gender at Midland College since 2012.
| Year | Total | Men | Women |
|---|---|---|---|
| 2012-13 | 5,530 | 2,195 | 3,335 |
| 2013-14 | 5,233 -297 | 2,137 -58 | 3,096 -239 |
| 2014-15 | 4,618 -615 | 1,920 -217 | 2,698 -398 |
| 2015-16 | 5,430 812 | 2,358 438 | 3,072 374 |
| 2016-17 | 5,645 215 | 2,396 38 | 3,249 177 |
| 2017-18 | 5,564 -81 | 2,434 38 | 3,130 -119 |
| 2018-19 | 5,452 -112 | 2,187 -247 | 3,265 135 |
| 2019-20 | 5,115 -337 | 2,040 -147 | 3,075 -190 |
| 2020-21 | 4,737 -378 | 1,852 -188 | 2,885 -190 |
| 2021-22 | 5,016 279 | 1,955 103 | 3,061 176 |
| 2022-23 | 5,404 388 | 2,201 246 | 3,203 142 |
| Average | 5,249 | 2,152 | 3,097 |