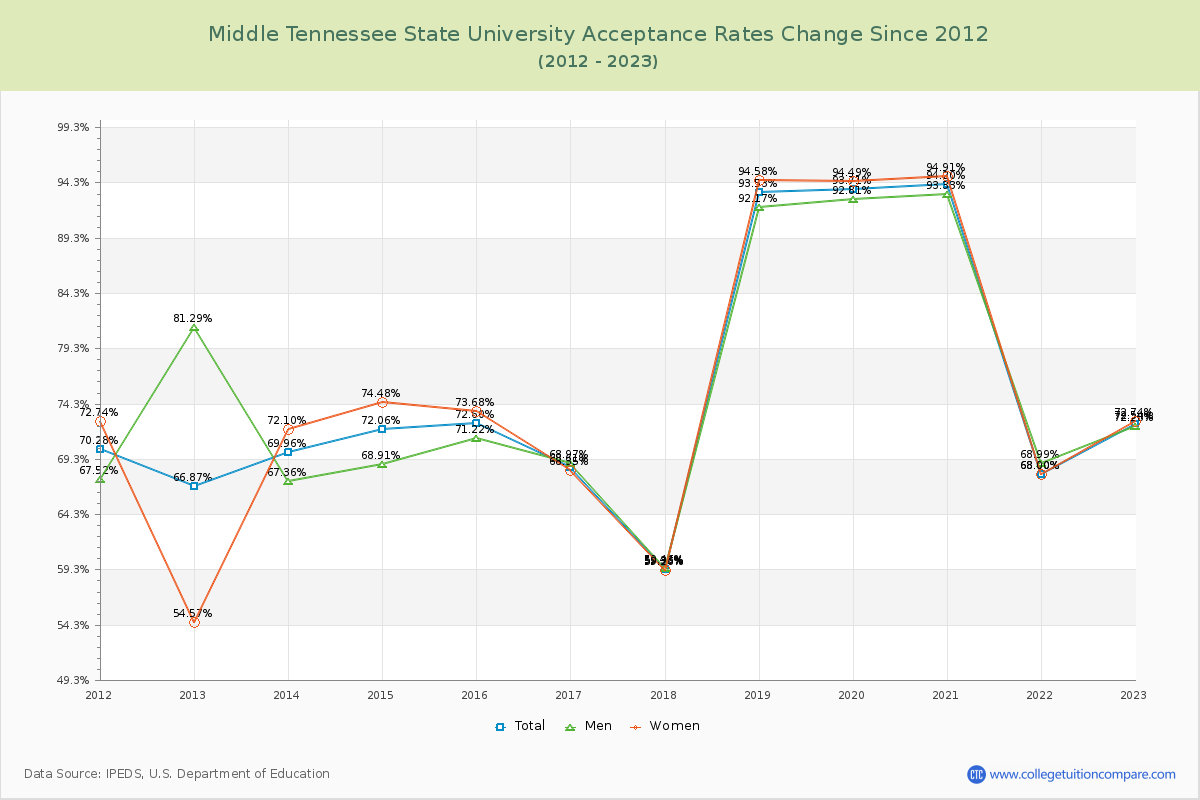
Acceptance Rate Changes
The average acceptance rate over the last 10 years is 75.59%, and this year's acceptance rate is 72.54% at Middle Tennessee State University. By gender, men students' acceptance rate is 76.07% and women students' rate is 75.20%.
The next table and chart illustrate the acceptance rates changes at Middle Tennessee State University over the past 11 years (2012-2023).
| Year | Total | Men | Women |
|---|---|---|---|
| 2012-13 | 66.87% | 81.29% | 54.57% |
| 2013-14 | 69.96% 3.10% |
67.36% 17.53% |
72.10% 17.53% |
| 2014-15 | 72.06% 2.10% |
68.91% 2.38% |
74.48% 2.38% |
| 2015-16 | 72.60% 0.54% |
71.22% -0.81% |
73.68% -0.81% |
| 2016-17 | 68.61% -3.99% |
68.97% -5.33% |
68.35% -5.33% |
| 2017-18 | 59.35% -9.26% |
59.46% -9.09% |
59.26% -9.09% |
| 2018-19 | 93.53% 34.18% |
92.17% 35.32% |
94.58% 35.32% |
| 2019-20 | 93.71% 0.18% |
92.81% -0.08% |
94.49% -0.08% |
| 2020-21 | 94.20% 0.48% |
93.33% 0.41% |
94.91% 0.41% |
| 2021-22 | 68.00% -26.19% |
68.99% -26.90% |
68.00% -26.90% |
| 2022-23 | 72.54% 4.54% |
72.28% 4.74% |
72.74% 4.74% |
| Average | 75.59% | 76.07% | 75.20% |