Enrollment Trends at Mid-Plains CC

-95

Total Enrollment

-69

Men

-26

Women

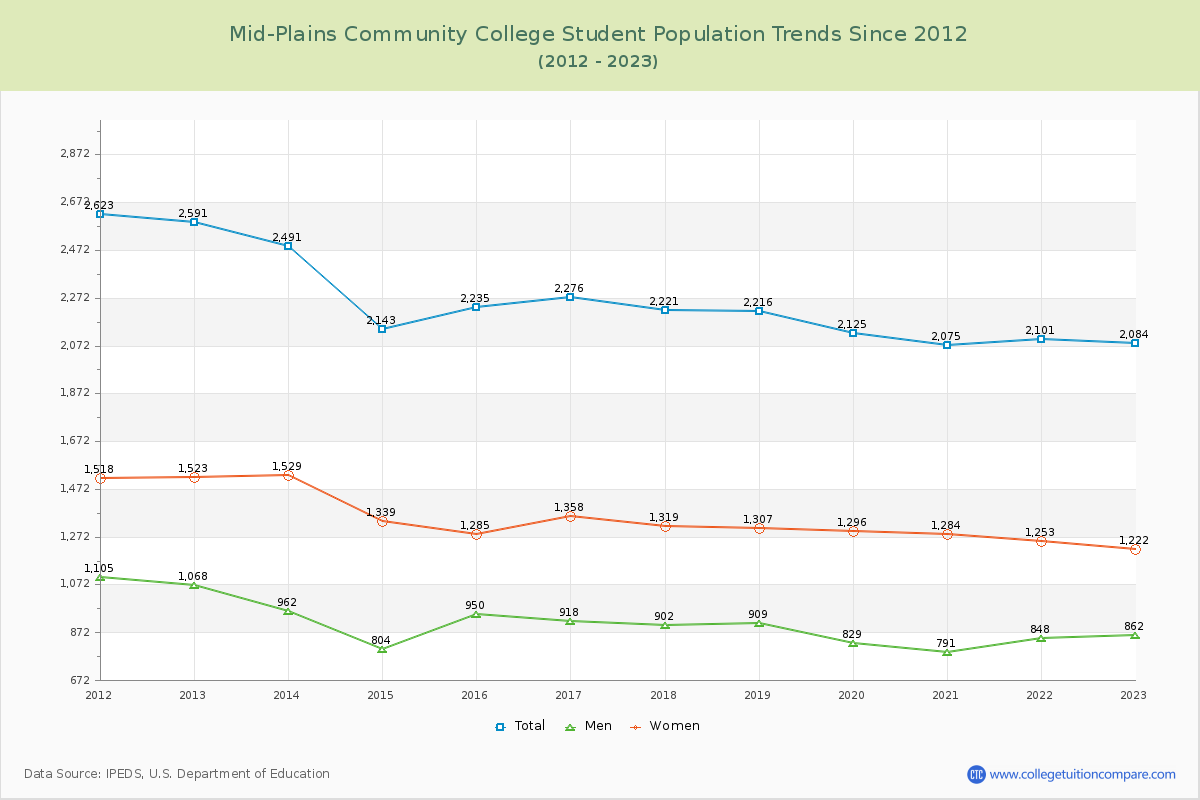
The student population at Mid-Plains Community College is 2,140 (all undergraduate). The number of students has decreased by 95 over the past decade.

The female to male ratio is 1.43 to 1 which means that female students enrolled more than male students.

541 students enrolled in online degree program exclusively and the number of online students has increased by 38.36% since 2015.

Student Population Changes

The average student population over the last 11 years is 2,154 where 2,140 students are attending the school for the academic year 2024-2025.

The female to male ratio is 1.43 to 1 and it means that there are more female students enrolled in Mid-Plains CC than male students.

The following table and chart illustrate the changes in student population by gender at Mid-Plains Community College since 2015.

YearTotalMenWomen
2015-162,2359501,285
2016-172,276
41
918
-32
1,358
73
2017-182,221
-55
902
-16
1,319
-39
2018-192,216
-5
909
7
1,307
-12
2019-202,125
-91
829
-80
1,296
-11
2020-212,075
-50
791
-38
1,284
-12
2021-222,101
26
848
57
1,253
-31
2022-232,084
-17
862
14
1,222
-31
2023-242,066
-18
854
-8
1,212
-10
2024-252,140
74
881
27
1,259
47
Average2,1548741,280
Mid-Plains Community College Enrollment Trends Chart

Enrollment by Race/Ethnicity Changes

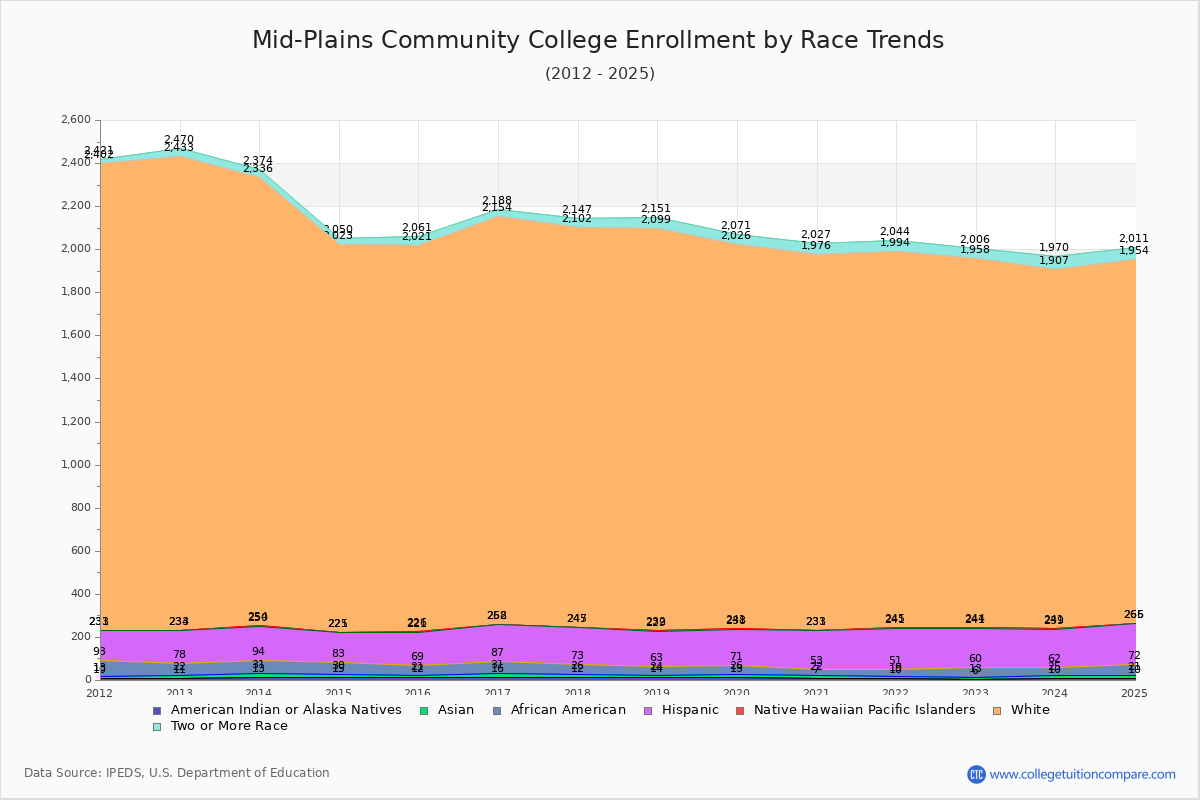
The percentage of white students is 78.88%. The percentage was 80.31% 10 years ago and Mid-Plains CC still has a high percentage of white students. 0.51% of enrolled students is Asian and 2.38% is black students. Hispanic students comprise 9.02% of the student body.

Over the past 10 years, the racial composition has shifted. The percentage of white students decreased from 80.31% to 78.88%. Asian enrollment grew from 0.40% to 0.51%. Black student enrollment increased from 2.15% to 2.38%. Hispanic student representation expanded from 6.80% to 9.02%.

The overall racial diversity, measured by the Census Bureau Diversity Index, is 0.3684 which indicates that somewhat diverse. This increased from 0.3495 a decade ago, suggesting that racial diversity has improved.

The following table and chart illustrate the student population trends by race/ethnicity at Mid-Plains Community College over the past 11 years (2015-2025).

YearAmerican Indian or Native AmericanAsianBlackHispanicNative Hawaiian or Other Pacific IslanderWhiteTwo or More Races
2015-161294815251,79540
2016-1716155617141,89234
2017-1812144717221,85545
2018-1914103916631,86752
2019-2013134516731,78545
2020-217153117821,74351
2021-221093219041,74950
2022-23674718131,71448
2023-2410153717721,66663
2024-2510115119311,68857
Average11124317531,77549
Mid-Plains Community College Enrollment by Race Trends Chart

Distance Learning (Online Courses) Enrollment Changes

541 students are enrolled in online degree programs exclusively for the academic year 2024-2025, which is 25% of total students. The number of online students has increased 38.36% since 2015. The following table and chart illustrate the changes in the online student population by enrolled type at Mid-Plains Community College from 2015 to 2025.

YearTotal EnrollmentOnline CompletelyEnrolled in Some Online CoursesNot Enrolled in Online Courses
2015-162,2353914271,417
2016-172,2762415761,459
2017-182,2213167641,141
2018-192,216480787949
2019-202,125496770859
2020-212,075585657833
2021-222,101483675943
2022-232,0845105271,047
2023-242,066506590970
2024-252,1405415541,045
Average2,1544556331,066

Ratings & Review

Share your experiences and thoughts about Mid-Plains Community College. It will be a great help to applicants and prospective students!