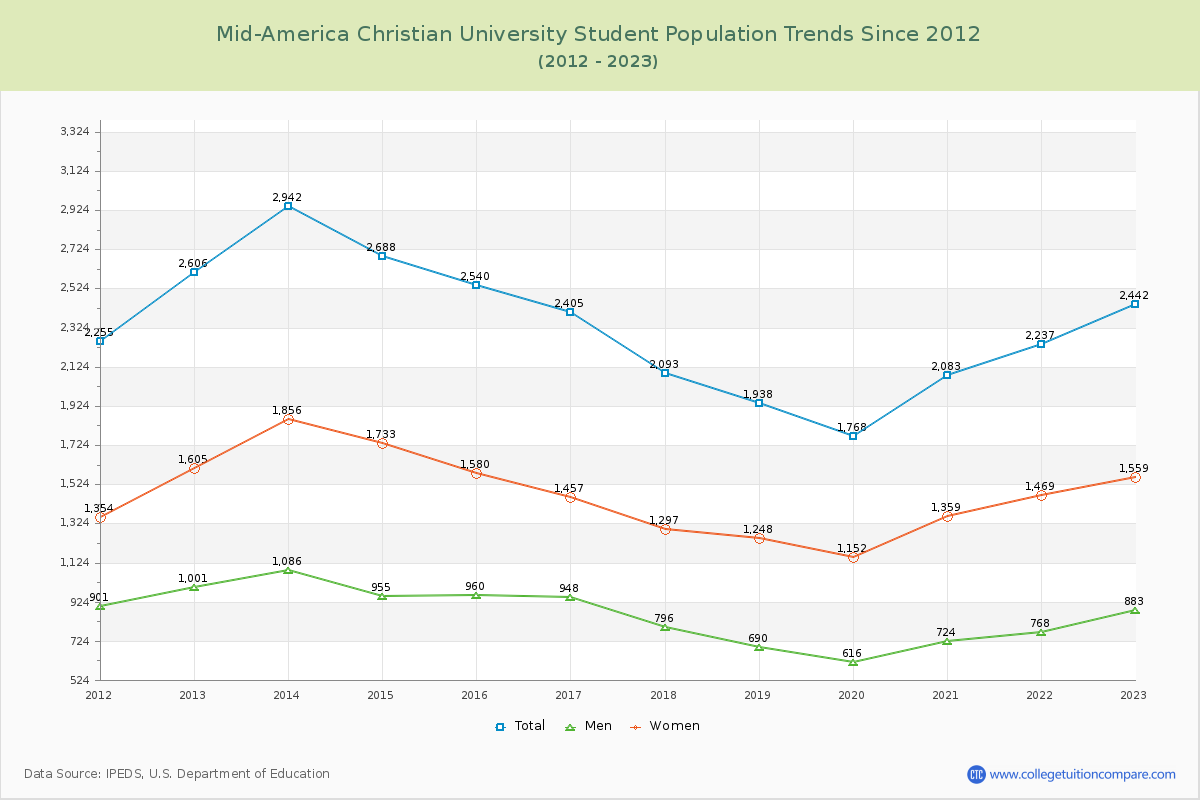
Student Population Changes
The average student population over the last 12 years is 2,340 where 2,442 students are attending the school for the academic year 2022-2023.
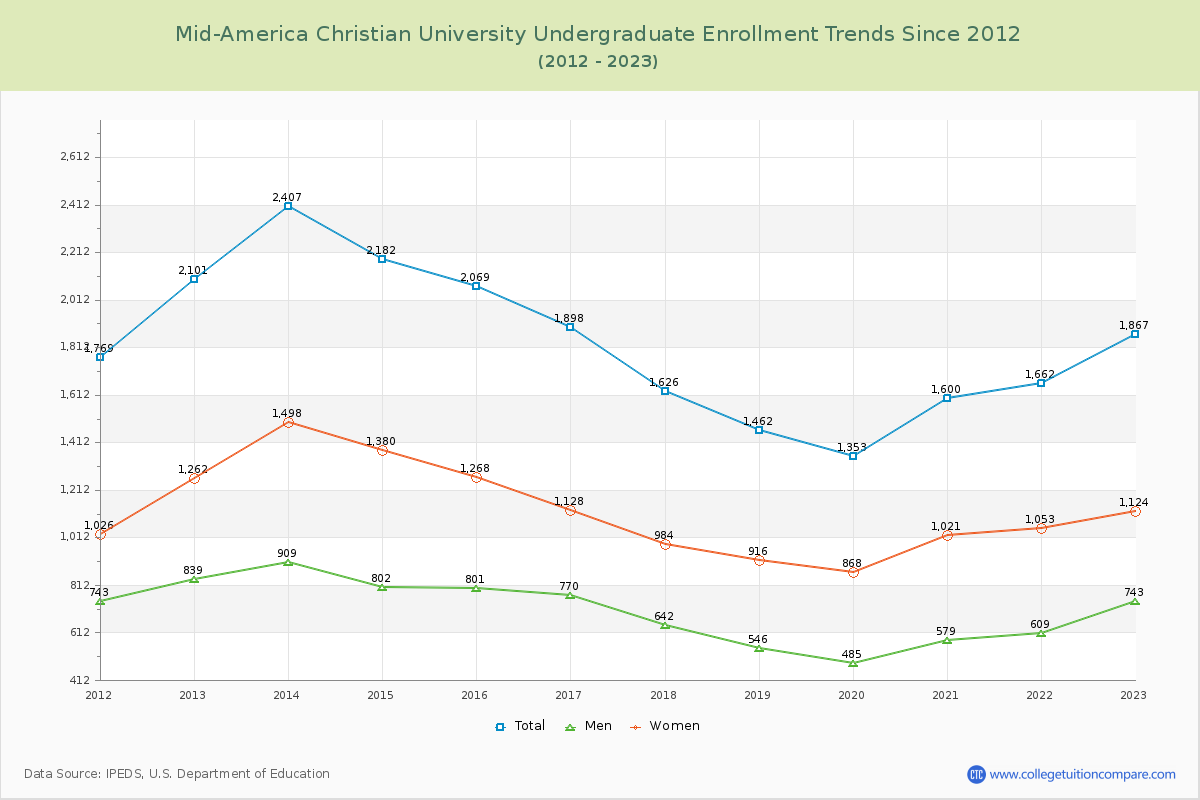
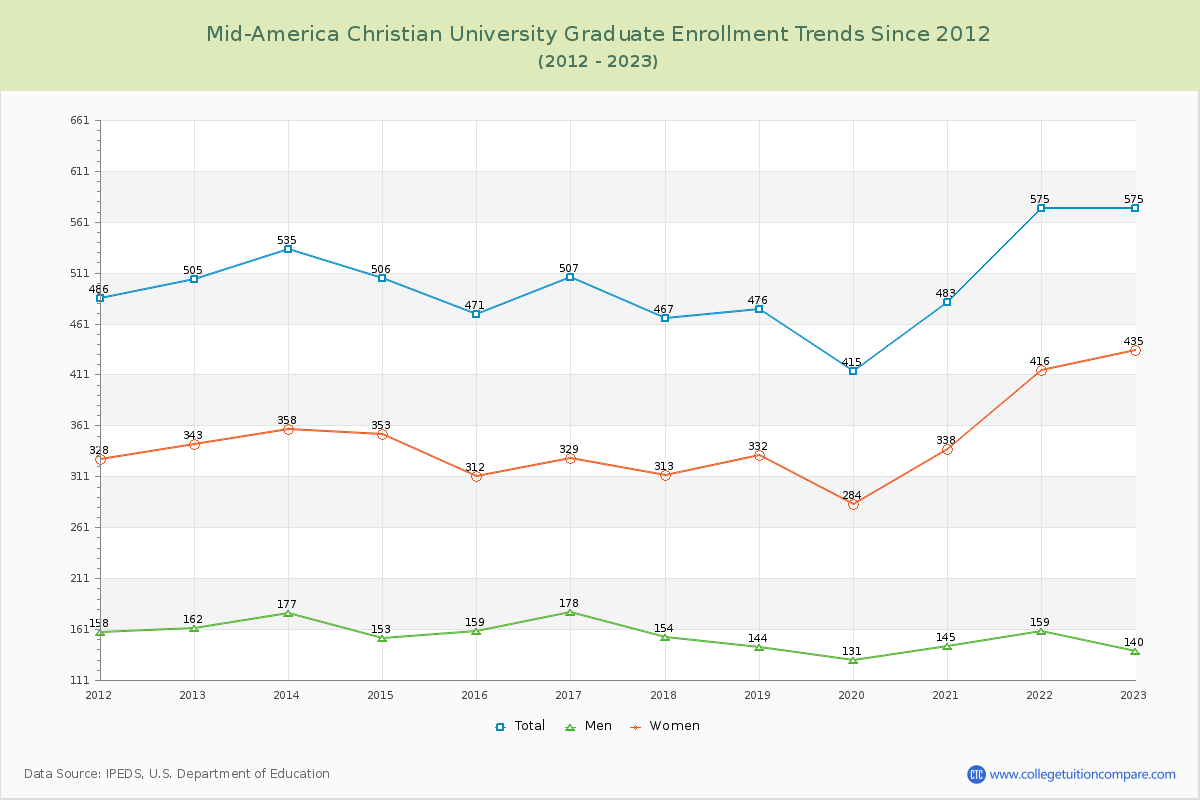
76.45% of total students is undergraduate students and 23.55% students is graduate students. The number of undergraduate students has decreased by 234 and the graduate enrollment has increased by 70 over past 10 years.
The female to male ratio is 1.77 to 1 and it means that there are more female students enrolled in MACU than male students.
The following table and chart illustrate the changes in student population by gender at Mid-America Christian University since 2012.
| Year | Total | Undergraduate | Graduate | ||||
|---|---|---|---|---|---|---|---|
| Total | Men | Women | Total | Men | Women | ||
| 2012-13 | 2,606 | 2,101 | 839 | 1,262 | 505 | 162 | 343 |
| 2013-14 | 2,942 336 | 2,407 306 | 909 70 | 1,498 236 | 535 30 | 177 15 | 358 15 |
| 2014-15 | 2,688 -254 | 2,182 -225 | 802 -107 | 1,380 -118 | 506 -29 | 153 -24 | 353 -5 |
| 2015-16 | 2,540 -148 | 2,069 -113 | 801 -1 | 1,268 -112 | 471 -35 | 159 6 | 312 -41 |
| 2016-17 | 2,405 -135 | 1,898 -171 | 770 -31 | 1,128 -140 | 507 36 | 178 19 | 329 17 |
| 2017-18 | 2,093 -312 | 1,626 -272 | 642 -128 | 984 -144 | 467 -40 | 154 -24 | 313 -16 |
| 2018-19 | 1,938 -155 | 1,462 -164 | 546 -96 | 916 -68 | 476 9 | 144 -10 | 332 19 |
| 2019-20 | 1,768 -170 | 1,353 -109 | 485 -61 | 868 -48 | 415 -61 | 131 -13 | 284 -48 |
| 2020-21 | 2,083 315 | 1,600 247 | 579 94 | 1,021 153 | 483 68 | 145 14 | 338 54 |
| 2021-22 | 2,237 154 | 1,662 62 | 609 30 | 1,053 32 | 575 92 | 159 14 | 416 78 |
| 2022-23 | 2,442 205 | 1,867 205 | 743 134 | 1,124 71 | 575 0 | 140 -19 | 435 19 |
| Average | 2,340 | 1,839 | 702 | 1,137 | 501 | 155 | 347 |