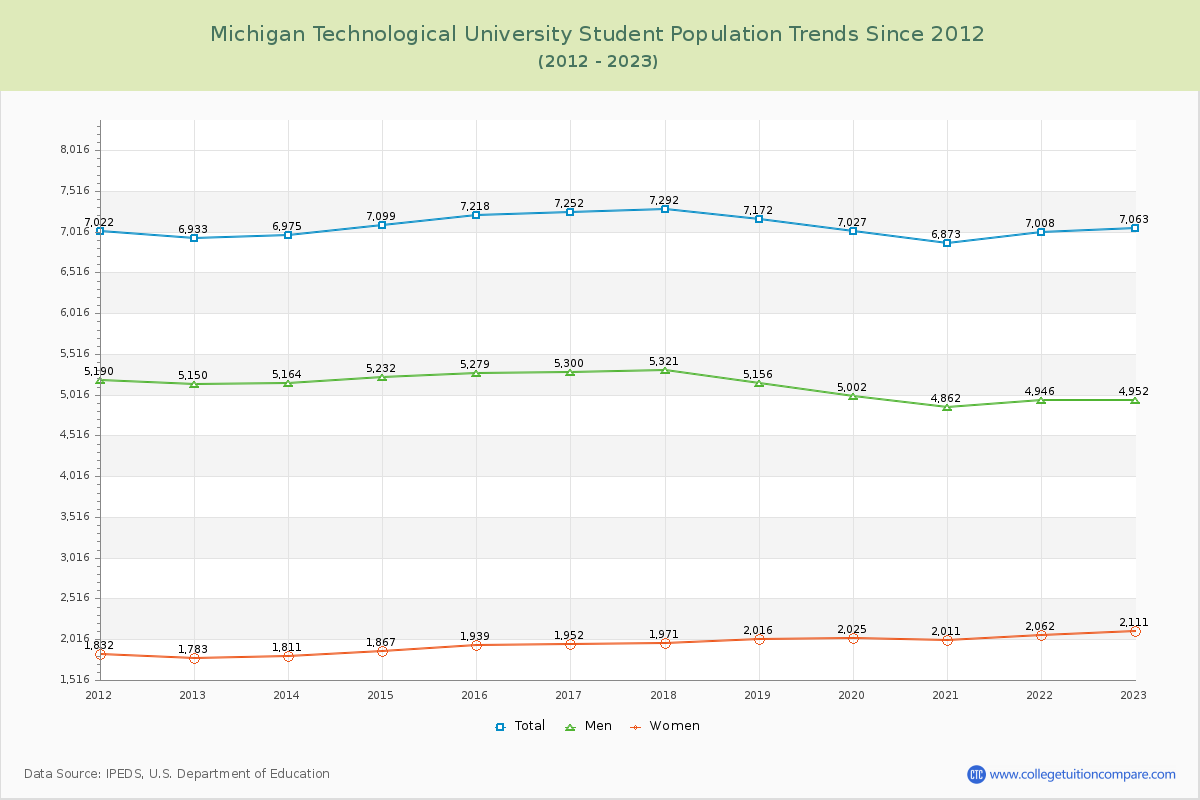
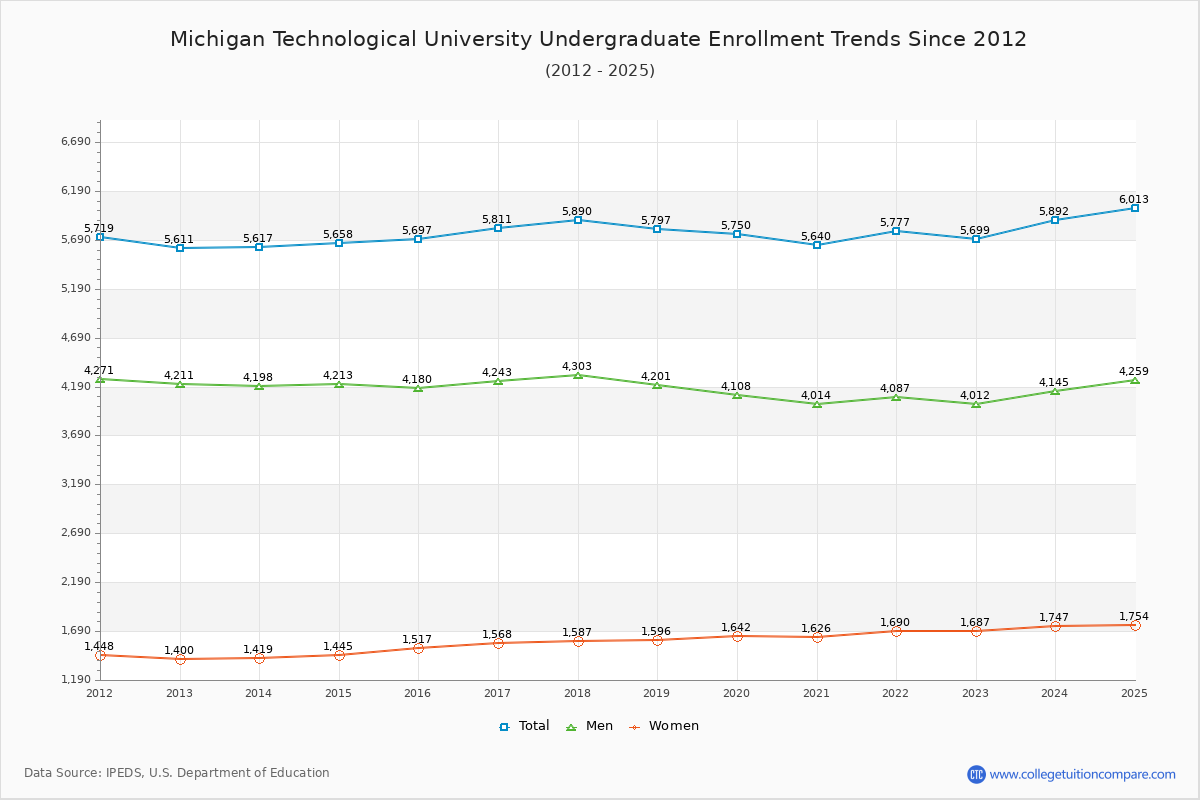
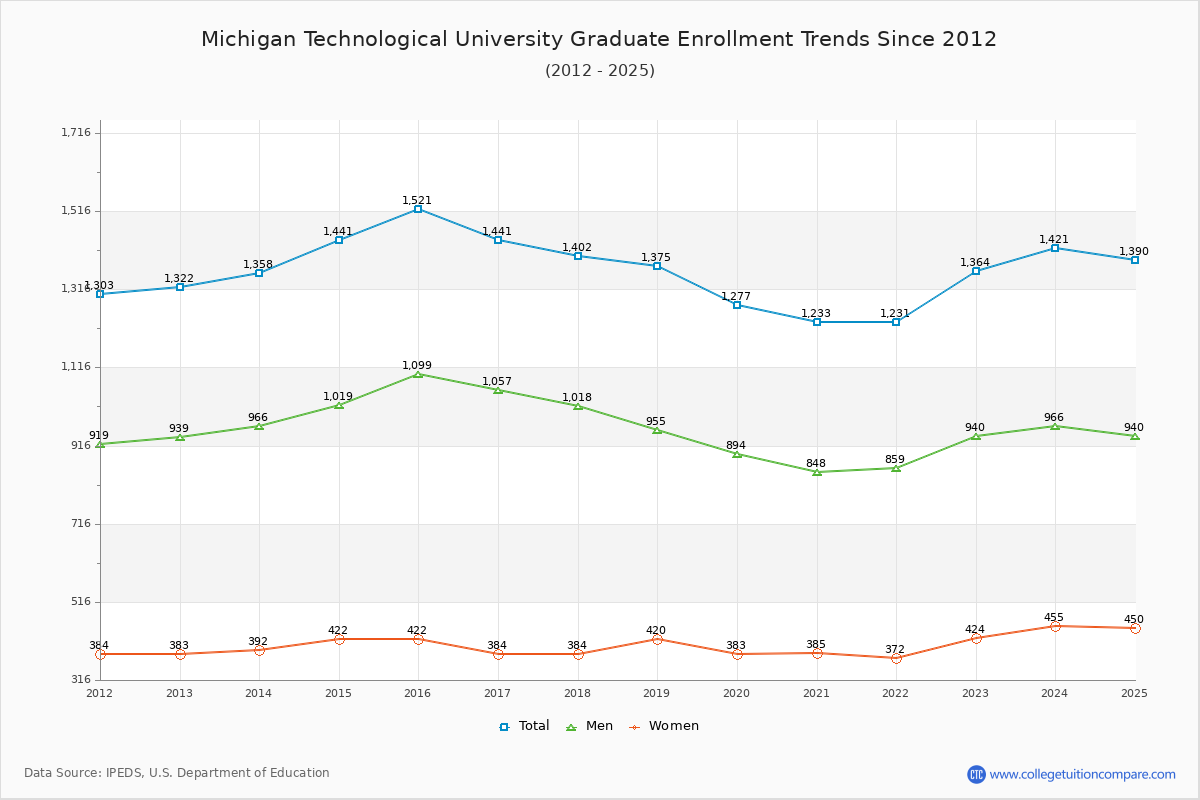
Student Population Changes
The average student population over the last 12 years is 7,083 where 7,063 students are attending the school for the academic year 2022-2023.
80.69% of total students is undergraduate students and 19.31% students is graduate students. The number of undergraduate students has increased by 88 and the graduate enrollment has increased by 42 over past 10 years.
The female to male ratio is 0.43 to 1 and it means that there are far more male students enrolled in MTU than female students.
The following table and chart illustrate the changes in student population by gender at Michigan Technological University since 2012.
| Year | Total | Undergraduate | Graduate | ||||
|---|---|---|---|---|---|---|---|
| Total | Men | Women | Total | Men | Women | ||
| 2012-13 | 6,933 | 5,611 | 4,211 | 1,400 | 1,322 | 939 | 383 |
| 2013-14 | 6,975 42 | 5,617 6 | 4,198 -13 | 1,419 19 | 1,358 36 | 966 27 | 392 9 |
| 2014-15 | 7,099 124 | 5,658 41 | 4,213 15 | 1,445 26 | 1,441 83 | 1,019 53 | 422 30 |
| 2015-16 | 7,218 119 | 5,697 39 | 4,180 -33 | 1,517 72 | 1,521 80 | 1,099 80 | 422 0 |
| 2016-17 | 7,252 34 | 5,811 114 | 4,243 63 | 1,568 51 | 1,441 -80 | 1,057 -42 | 384 -38 |
| 2017-18 | 7,292 40 | 5,890 79 | 4,303 60 | 1,587 19 | 1,402 -39 | 1,018 -39 | 384 0 |
| 2018-19 | 7,172 -120 | 5,797 -93 | 4,201 -102 | 1,596 9 | 1,375 -27 | 955 -63 | 420 36 |
| 2019-20 | 7,027 -145 | 5,750 -47 | 4,108 -93 | 1,642 46 | 1,277 -98 | 894 -61 | 383 -37 |
| 2020-21 | 6,873 -154 | 5,640 -110 | 4,014 -94 | 1,626 -16 | 1,233 -44 | 848 -46 | 385 2 |
| 2021-22 | 7,008 135 | 5,777 137 | 4,087 73 | 1,690 64 | 1,231 -2 | 859 11 | 372 -13 |
| 2022-23 | 7,063 55 | 5,699 -78 | 4,012 -75 | 1,687 -3 | 1,364 133 | 940 81 | 424 52 |
| Average | 7,083 | 5,722 | 4,161 | 1,562 | 1,360 | 963 | 397 |