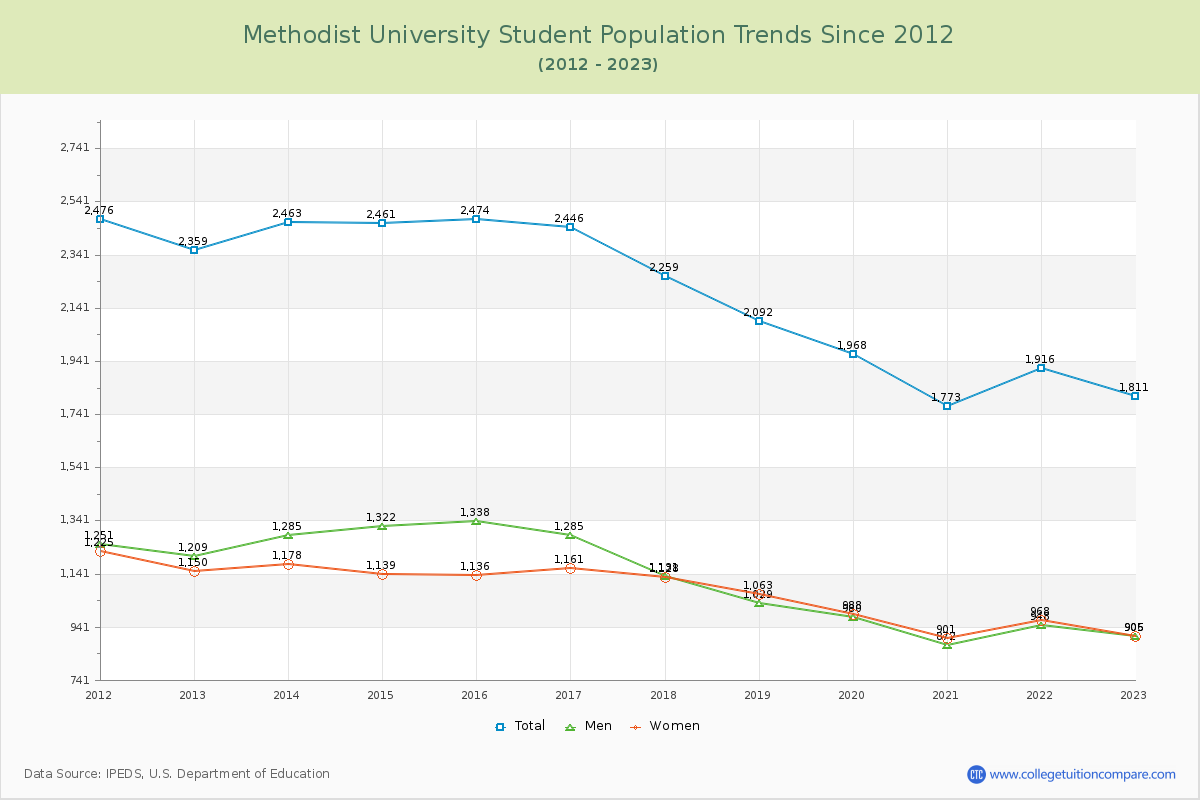
Student Population Changes
The average student population over the last 12 years is 2,184 where 1,811 students are attending the school for the academic year 2022-2023.
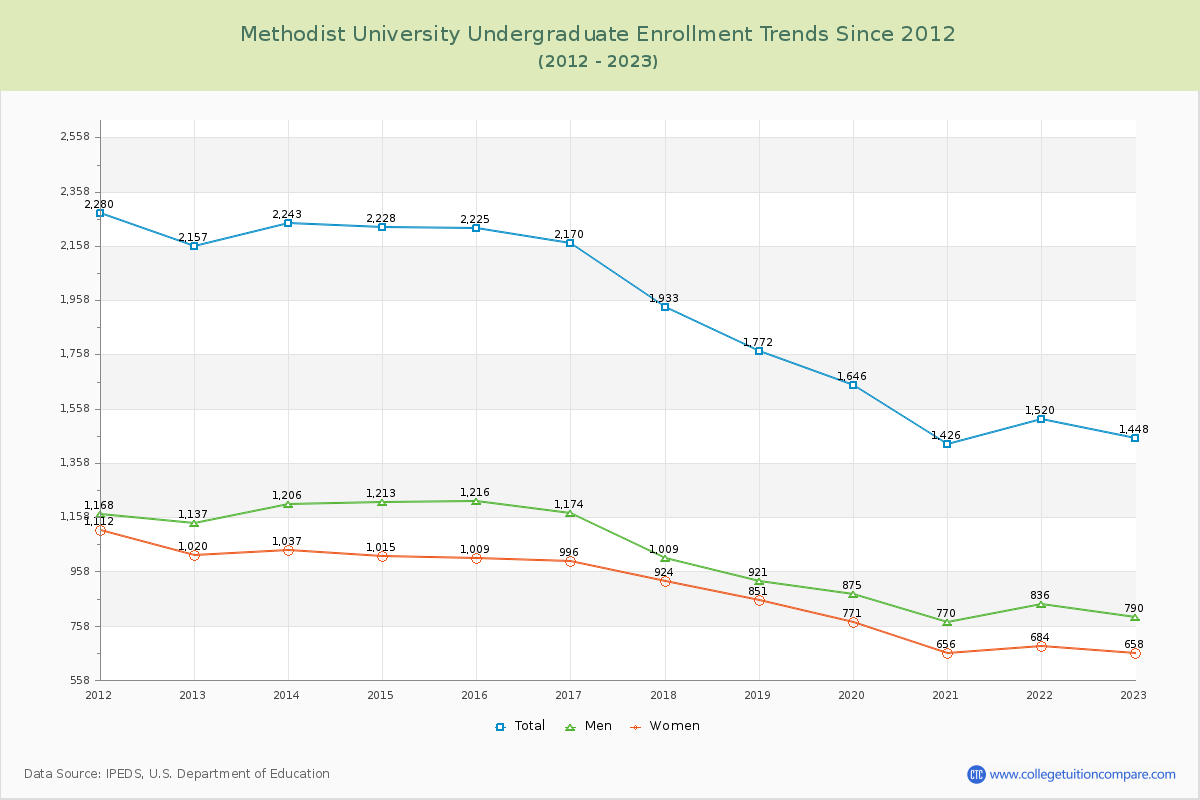
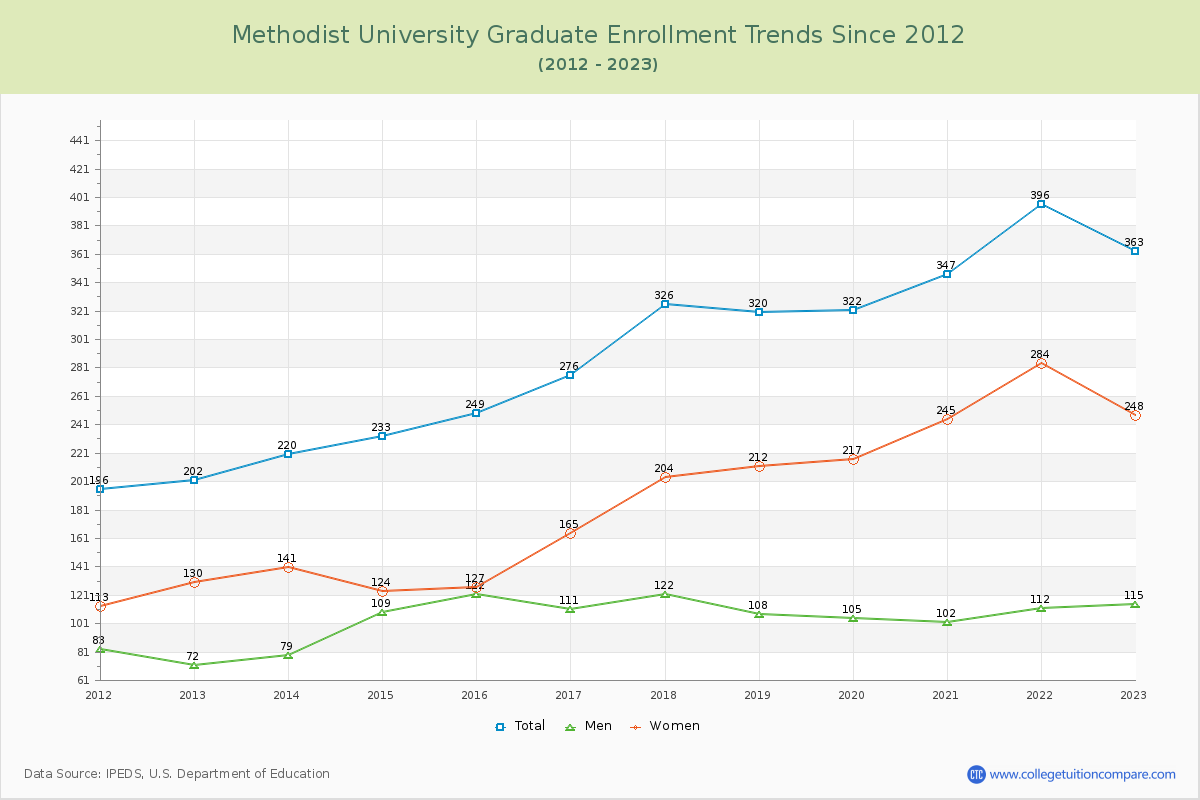
79.96% of total students is undergraduate students and 20.04% students is graduate students. The number of undergraduate students has decreased by 709 and the graduate enrollment has increased by 161 over past 10 years.
The female to male ratio is 1.00 to 1 and it means that there are similar numbers of female and male students enrolled in Methodist.
The following table and chart illustrate the changes in student population by gender at Methodist University since 2012.
| Year | Total | Undergraduate | Graduate | ||||
|---|---|---|---|---|---|---|---|
| Total | Men | Women | Total | Men | Women | ||
| 2012-13 | 2,359 | 2,157 | 1,137 | 1,020 | 202 | 72 | 130 |
| 2013-14 | 2,463 104 | 2,243 86 | 1,206 69 | 1,037 17 | 220 18 | 79 7 | 141 11 |
| 2014-15 | 2,461 -2 | 2,228 -15 | 1,213 7 | 1,015 -22 | 233 13 | 109 30 | 124 -17 |
| 2015-16 | 2,474 13 | 2,225 -3 | 1,216 3 | 1,009 -6 | 249 16 | 122 13 | 127 3 |
| 2016-17 | 2,446 -28 | 2,170 -55 | 1,174 -42 | 996 -13 | 276 27 | 111 -11 | 165 38 |
| 2017-18 | 2,259 -187 | 1,933 -237 | 1,009 -165 | 924 -72 | 326 50 | 122 11 | 204 39 |
| 2018-19 | 2,092 -167 | 1,772 -161 | 921 -88 | 851 -73 | 320 -6 | 108 -14 | 212 8 |
| 2019-20 | 1,968 -124 | 1,646 -126 | 875 -46 | 771 -80 | 322 2 | 105 -3 | 217 5 |
| 2020-21 | 1,773 -195 | 1,426 -220 | 770 -105 | 656 -115 | 347 25 | 102 -3 | 245 28 |
| 2021-22 | 1,916 143 | 1,520 94 | 836 66 | 684 28 | 396 49 | 112 10 | 284 39 |
| 2022-23 | 1,811 -105 | 1,448 -72 | 790 -46 | 658 -26 | 363 -33 | 115 3 | 248 -36 |
| Average | 2,184 | 1,888 | 1,013 | 875 | 296 | 105 | 191 |