Enrollment Trends at Messiah

71

Total Enrollment

52

Men

19

Women

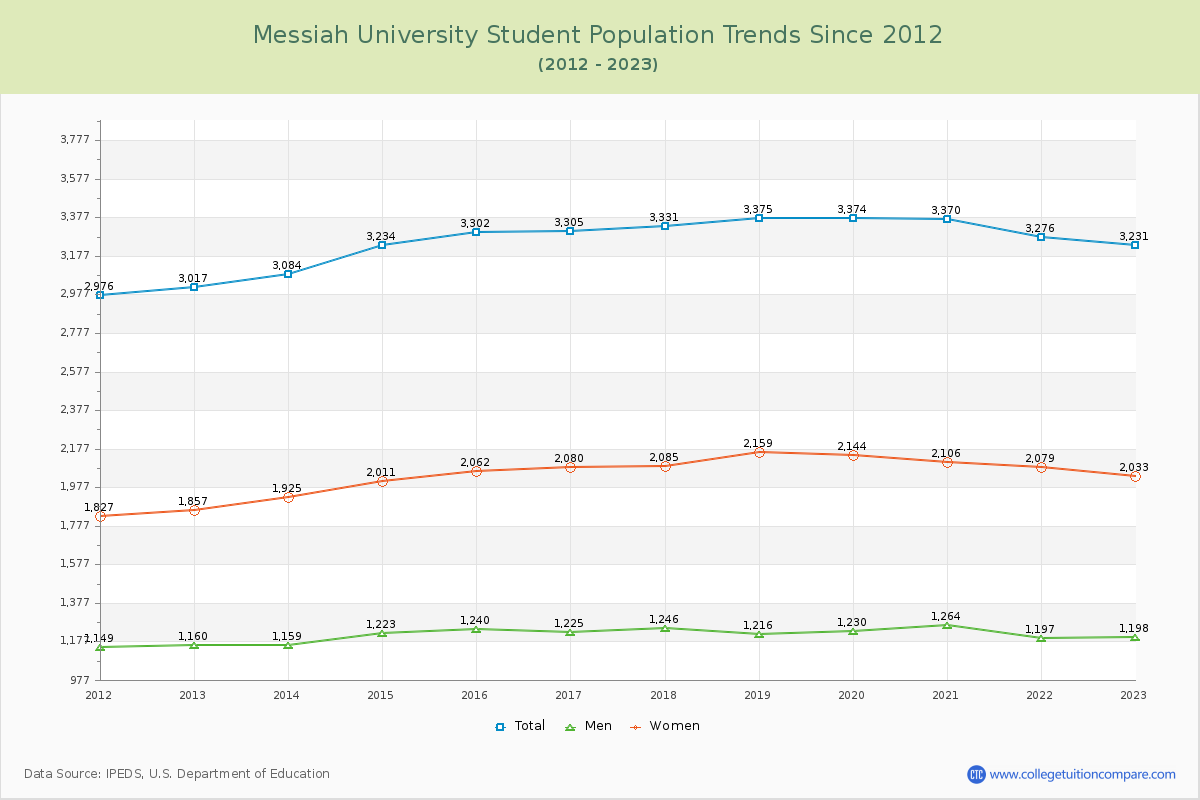
The student population at Messiah University is 3,373 (2,618 undergraduate and 755 graduate students) . The number of students has increased by 71 over the past decade.

The percentage of undergraduate students at Messiah is 77.62% which is decreased by 201 over last 10 years. The graduate student population increased by 272 and it has been increasing.

The female to male ratio is 1.61 to 1 which means that female students enrolled more than male students.

721 students enrolled in online degree program exclusively and the number of online students has increased by 76.72% since 2015.

Student Population Changes

The average student population over the last 11 years is 3,328 where 3,373 students are attending the school for the academic year 2024-2025.

77.62% of total students is undergraduate students and 22.38% students is graduate students. The number of undergraduate students has decreased by 201 and the graduate enrollment has increased by 272 over past 10 years.

The female to male ratio is 1.61 to 1 and it means that there are more female students enrolled in Messiah than male students.

The following table and chart illustrate the changes in student population by gender at Messiah University since 2015.

YearTotalUndergraduateGraduate
TotalMenWomenTotalMenWomen
2015-163,3022,8191,1061,713483134349
2016-173,305
3
2,788
-31
1,092
-14
1,696
-17
517
34
133
-1
384
35
2017-183,331
26
2,759
-29
1,106
14
1,653
-43
572
55
140
7
432
48
2018-193,375
44
2,734
-25
1,065
-41
1,669
16
641
69
151
11
490
58
2019-203,374
-1
2,709
-25
1,062
-3
1,647
-22
665
24
168
17
497
7
2020-213,370
-4
2,614
-95
1,043
-19
1,571
-76
756
91
221
53
535
38
2021-223,276
-94
2,495
-119
974
-69
1,521
-50
781
25
223
2
558
23
2022-233,231
-45
2,495978
4
1,517
-4
736
-45
220
-3
516
-42
2023-243,344
113
2,586
91
1,030
52
1,556
39
758
22
195
-25
563
47
2024-253,373
29
2,618
32
1,095
65
1,523
-33
755
-3
197
2
558
-5
Average3,3282,6621,0551,607666178488
Messiah University Enrollment Trends Chart

Undergraduate Enrollment Changes

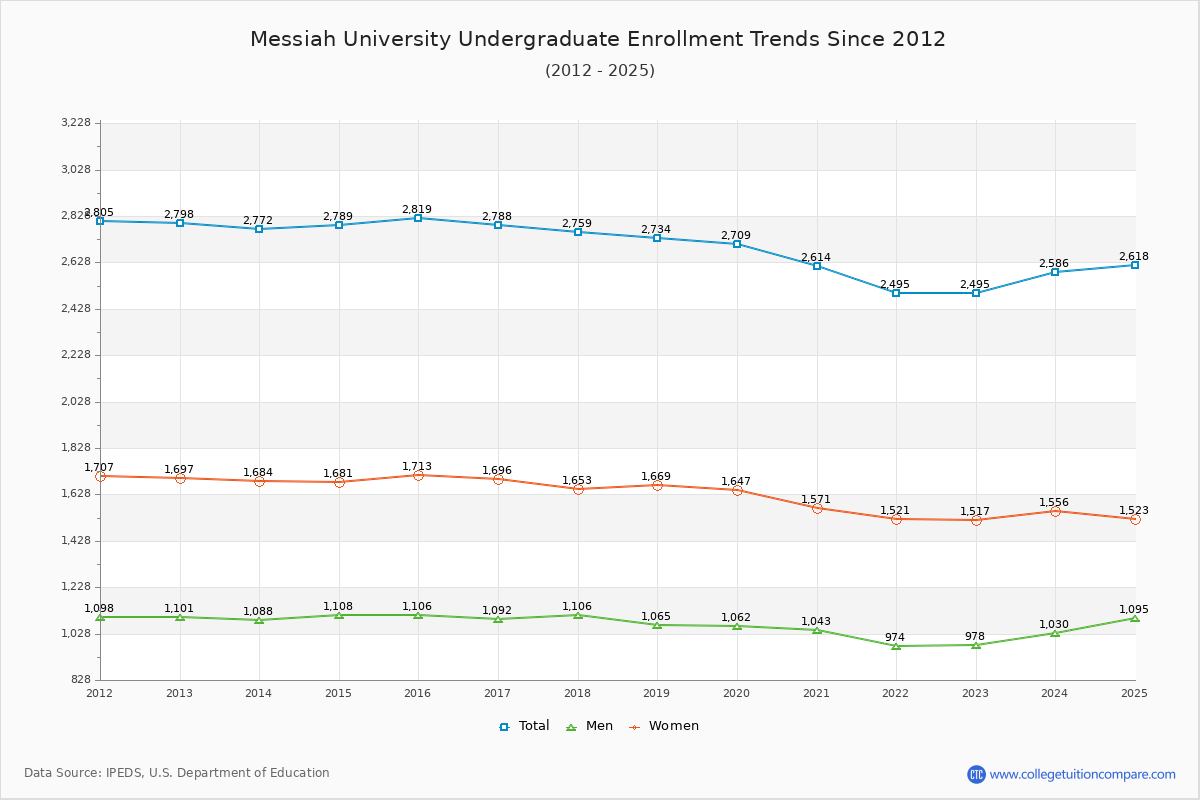
The average number of Undergraduate students over the last 11 years is 2,662 where 2,618 students are attending the Undergraduate school for the academic year 2024-2025. The following table and chart illustrate the changes in Undergraduate enrollment by attending status and gender at Messiah University since 2015.

YearTotalFull-timePart-time
TotalMenWomenTotalMenWomen
2015-162,8192,6811,0551,6261385187
2016-172,7882,6481,0501,5981404298
2017-182,7592,6371,0611,5761224577
2018-192,7342,5981,0211,5771364492
2019-202,7092,5451,0091,53616453111
2020-212,6142,4249701,45419073117
2021-222,4952,3048981,40619176115
2022-232,4952,2778991,37821879139
2023-242,5862,2549111,343332119213
2024-252,6182,2129381,274406157249
Average2,6622,6629811,4772,66274130
Messiah University Undergraduate Enrollment Trends Chart

Graduate Enrollment Changes

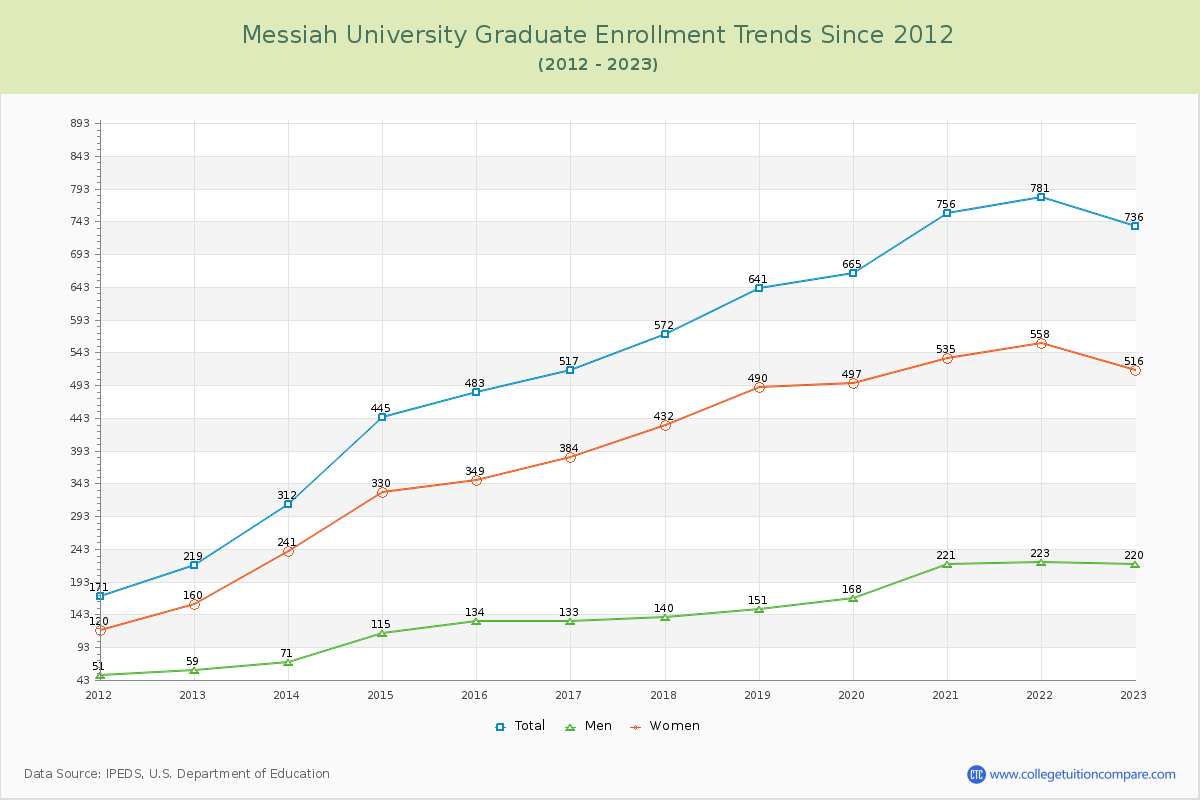
The average number of Graduate students over the last 11 years is 666 where 755 students are attending the Graduate school for the academic year 2024-2025. The following table and chart illustrate the changes in Graduate enrollment by attending status and gender at Messiah University since 2015.

YearTotalFull-timePart-time
TotalMenWomenTotalMenWomen
2015-164831032083380114266
2016-175171131697404117287
2017-1857215219133420121299
2018-1964118924165452127325
2019-2066522541184440127313
2020-2175629072218466149317
2021-2278128465219497158339
2022-2373626960209467160307
2023-2475827872206480123357
2024-2575527463211481134347
Average66666645173666133316
Messiah University Graduate Enrollment Trends Chart

Enrollment by Race/Ethnicity Changes

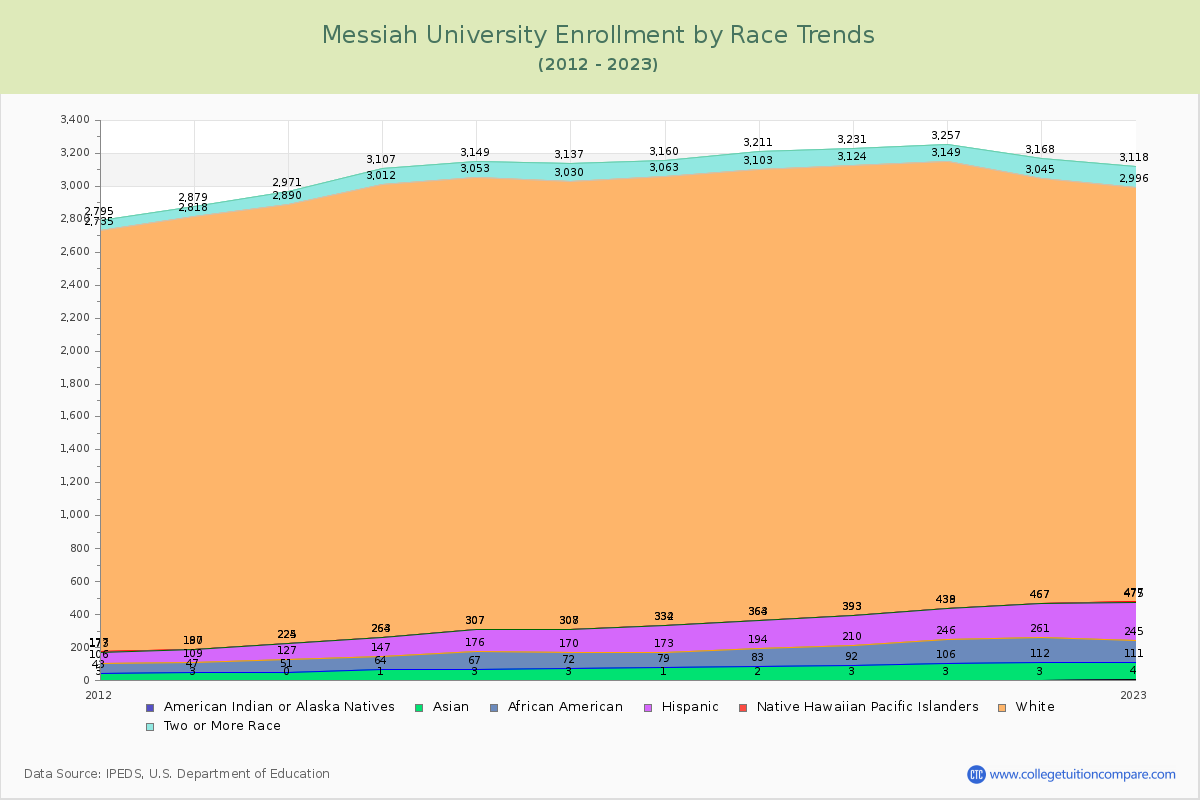
The percentage of white students is 75.21%. The percentage was 83.16% 10 years ago and Messiah still has a high percentage of white students. 3.68% of enrolled students is Asian and 4.71% is black students. Hispanic students comprise 8.51% of the student body.

Over the past 10 years, the racial composition has shifted. The percentage of white students decreased from 83.16% to 75.21%. Asian enrollment grew from 1.94% to 3.68%. Black student enrollment increased from 3.30% to 4.71%. Hispanic student representation expanded from 3.97% to 8.51%.

The overall racial diversity, measured by the Census Bureau Diversity Index, is 0.4219 which indicates that somewhat diverse. This increased from 0.3045 a decade ago, suggesting that racial diversity has improved.

The following table and chart illustrate the student population trends by race/ethnicity at Messiah University over the past 11 years (2015-2025).

YearAmerican Indian or Native AmericanAsianBlackHispanicNative Hawaiian or Other Pacific IslanderWhiteTwo or More Races
2015-1636410913102,74696
2016-173699813712,722107
2017-181789415922,72997
2018-1928111116912,739108
2019-2038911818302,731107
2020-21310314019212,710108
2021-22310914920602,578123
2022-23410713423022,519122
2023-24212815327042,550118
2024-25312415928732,537135
Average39512719612,656112
Messiah University Enrollment by Race Trends Chart

Distance Learning (Online Courses) Enrollment Changes

721 students are enrolled in online degree programs exclusively for the academic year 2024-2025, which is 21% of total students. The number of online students has increased 76.72% since 2015. The following table and chart illustrate the changes in the online student population by enrolled type at Messiah University from 2015 to 2025.

YearTotal EnrollmentOnline CompletelyEnrolled in Some Online CoursesNot Enrolled in Online Courses
2015-163,302408392,855
2016-173,305450312,824
2017-183,331491442,796
2018-193,375463862,826
2019-203,374445722,857
2020-213,3705019671,902
2021-223,2765842332,459
2022-233,2315595972,075
2023-243,3446605702,114
2024-253,3737216531,999
Average3,3285283292,471

Ratings & Review

Share your experiences and thoughts about Messiah University. It will be a great help to applicants and prospective students!