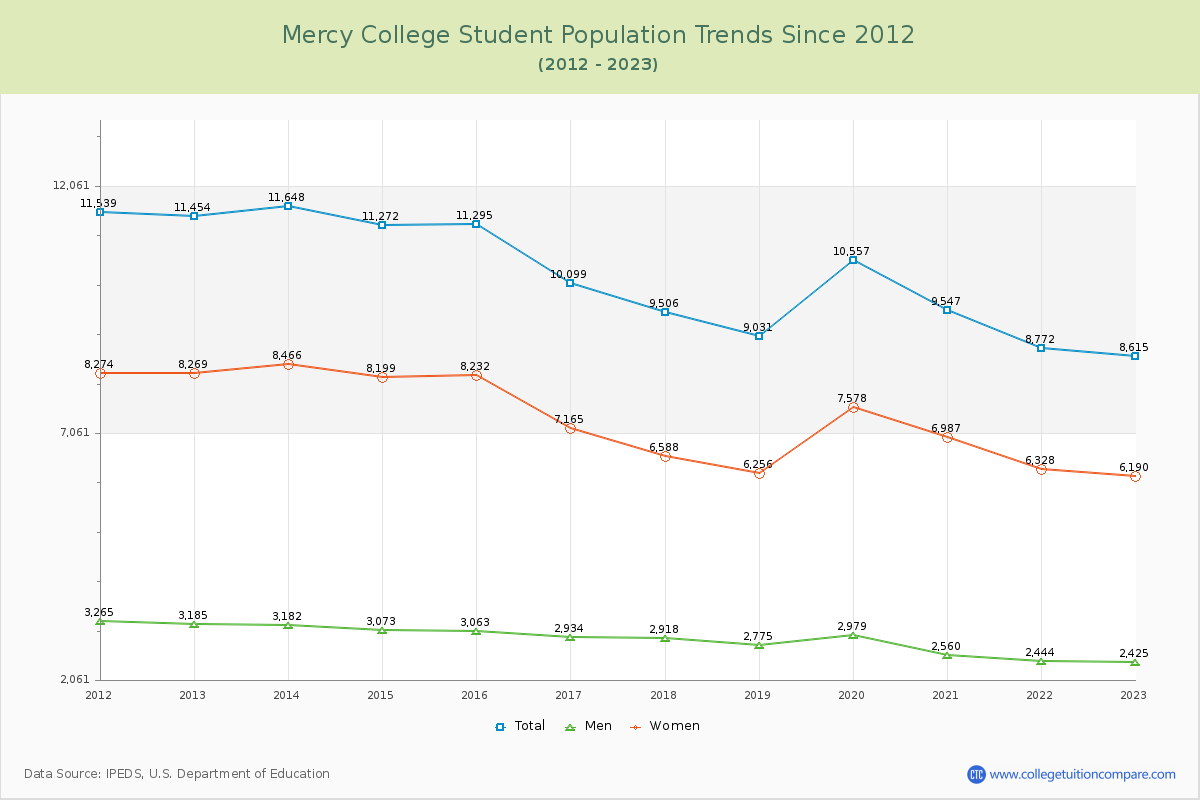
Student Population Changes
The average student population over the last 12 years is 10,163 where 8,615 students are attending the school for the academic year 2022-2023.
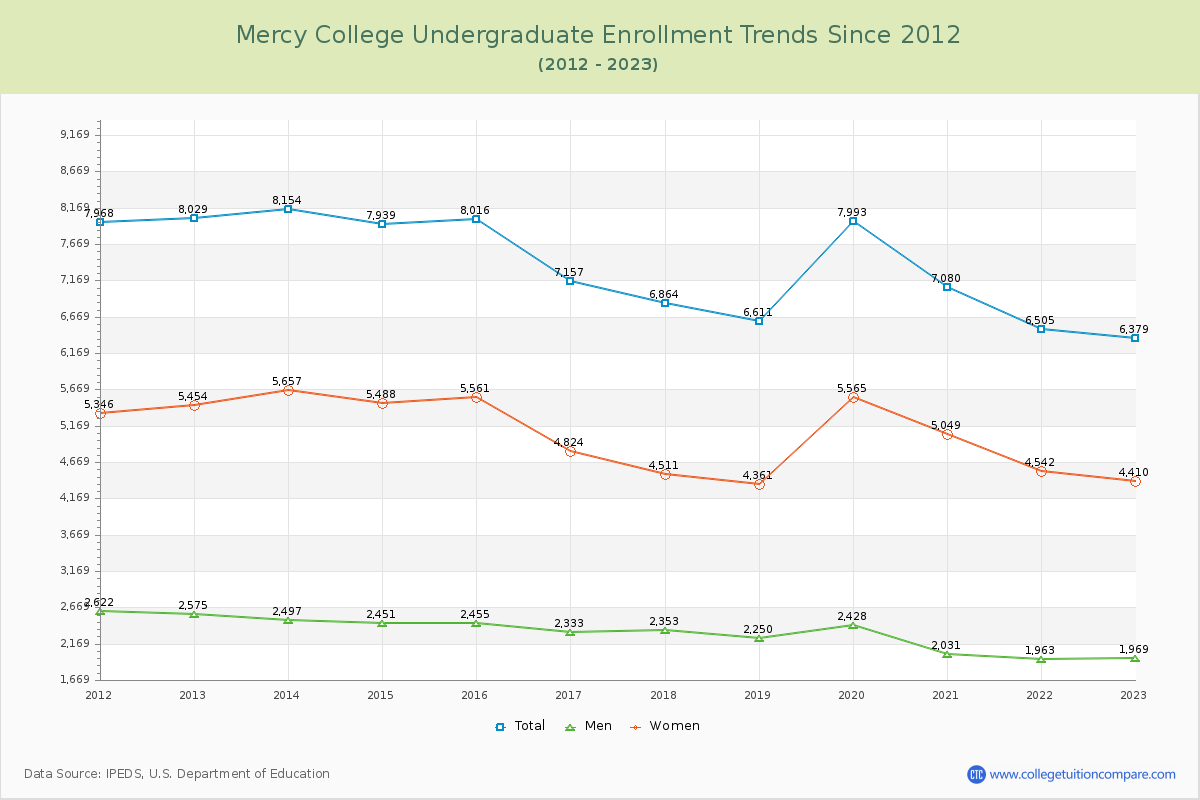
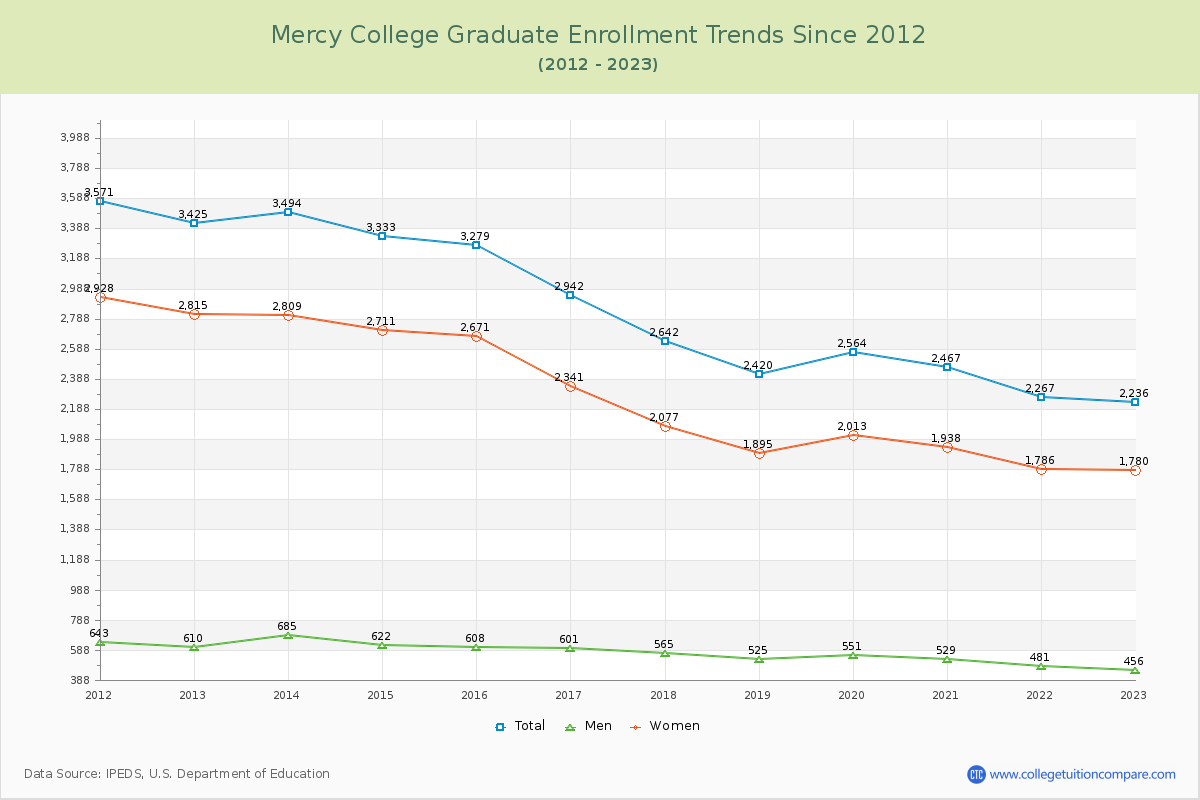
74.05% of total students is undergraduate students and 25.95% students is graduate students. The number of undergraduate students has decreased by 1,650 and the graduate enrollment has decreased by 1,189 over past 10 years.
The female to male ratio is 2.55 to 1 and it means that there are far more female students enrolled in Mercy than male students.
The following table and chart illustrate the changes in student population by gender at Mercy College since 2012.
| Year | Total | Undergraduate | Graduate | ||||
|---|---|---|---|---|---|---|---|
| Total | Men | Women | Total | Men | Women | ||
| 2012-13 | 11,454 | 8,029 | 2,575 | 5,454 | 3,425 | 610 | 2,815 |
| 2013-14 | 11,648 194 | 8,154 125 | 2,497 -78 | 5,657 203 | 3,494 69 | 685 75 | 2,809 -6 |
| 2014-15 | 11,272 -376 | 7,939 -215 | 2,451 -46 | 5,488 -169 | 3,333 -161 | 622 -63 | 2,711 -98 |
| 2015-16 | 11,295 23 | 8,016 77 | 2,455 4 | 5,561 73 | 3,279 -54 | 608 -14 | 2,671 -40 |
| 2016-17 | 10,099 -1,196 | 7,157 -859 | 2,333 -122 | 4,824 -737 | 2,942 -337 | 601 -7 | 2,341 -330 |
| 2017-18 | 9,506 -593 | 6,864 -293 | 2,353 20 | 4,511 -313 | 2,642 -300 | 565 -36 | 2,077 -264 |
| 2018-19 | 9,031 -475 | 6,611 -253 | 2,250 -103 | 4,361 -150 | 2,420 -222 | 525 -40 | 1,895 -182 |
| 2019-20 | 10,557 1,526 | 7,993 1,382 | 2,428 178 | 5,565 1,204 | 2,564 144 | 551 26 | 2,013 118 |
| 2020-21 | 9,547 -1,010 | 7,080 -913 | 2,031 -397 | 5,049 -516 | 2,467 -97 | 529 -22 | 1,938 -75 |
| 2021-22 | 8,772 -775 | 6,505 -575 | 1,963 -68 | 4,542 -507 | 2,267 -200 | 481 -48 | 1,786 -152 |
| 2022-23 | 8,615 -157 | 6,379 -126 | 1,969 6 | 4,410 -132 | 2,236 -31 | 456 -25 | 1,780 -6 |
| Average | 10,163 | 7,339 | 2,300 | 5,038 | 2,824 | 567 | 2,258 |