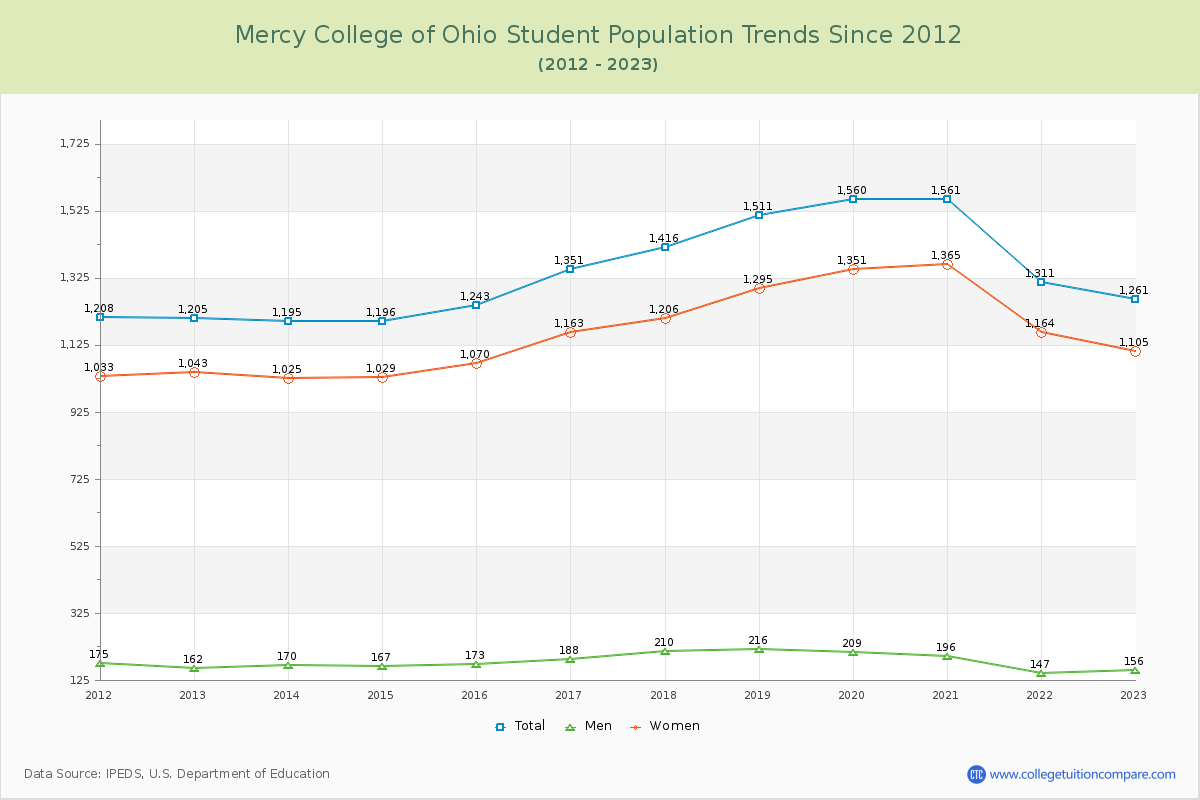
Student Population Changes
The average student population over the last 12 years is 1,346 where 1,261 students are attending the school for the academic year 2022-2023.
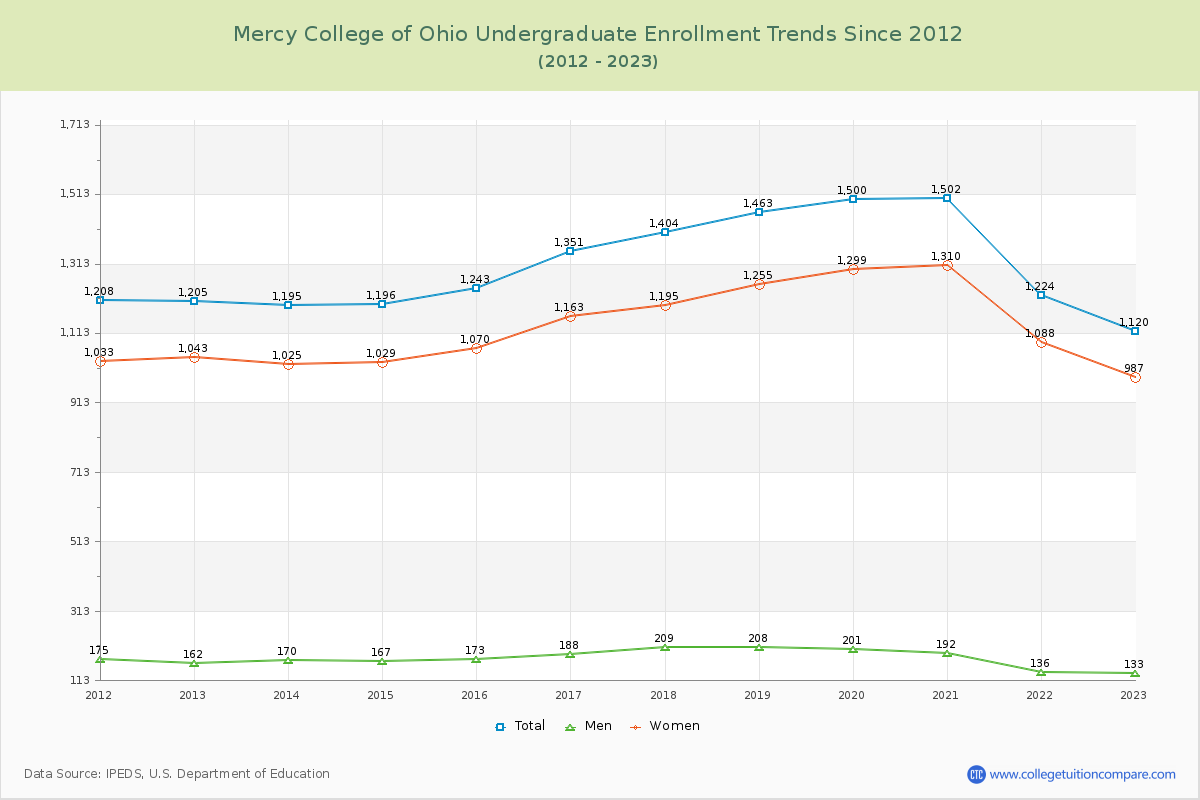
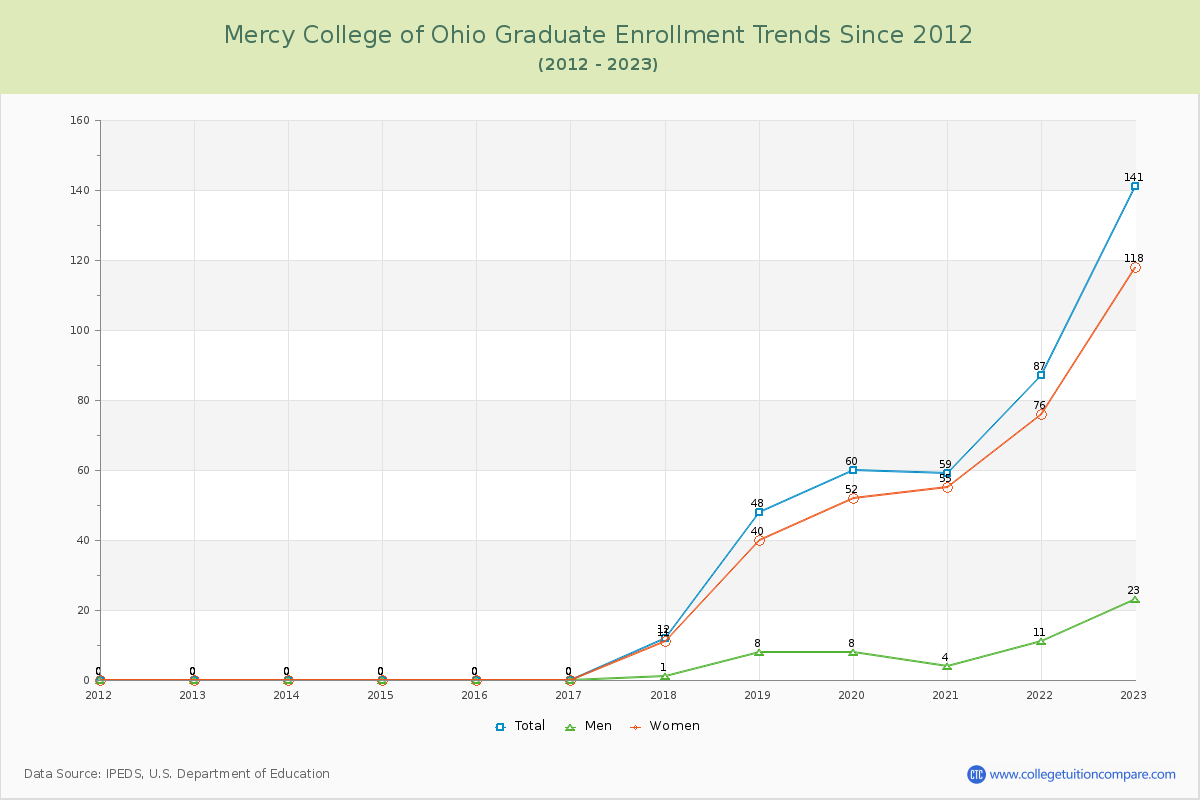
88.82% of total students is undergraduate students and 11.18% students is graduate students. The number of undergraduate students has decreased by 85 and the graduate enrollment has increased by 141 over past 10 years.
The female to male ratio is 7.08 to 1 and it means that there are far more female students enrolled in Mercy College of Ohio than male students.
The following table and chart illustrate the changes in student population by gender at Mercy College of Ohio since 2012.
| Year | Total | Undergraduate | Graduate | ||||
|---|---|---|---|---|---|---|---|
| Total | Men | Women | Total | Men | Women | ||
| 2012-13 | 1,205 | 1,205 | 162 | 1,043 | 0 | 0 | 0 |
| 2013-14 | 1,195 -10 | 1,195 -10 | 170 8 | 1,025 -18 | 0 0 | 0 0 | 0 0 |
| 2014-15 | 1,196 1 | 1,196 1 | 167 -3 | 1,029 4 | 0 0 | 0 0 | 0 0 |
| 2015-16 | 1,243 47 | 1,243 47 | 173 6 | 1,070 41 | 0 0 | 0 0 | 0 0 |
| 2016-17 | 1,351 108 | 1,351 108 | 188 15 | 1,163 93 | 0 0 | 0 0 | 0 0 |
| 2017-18 | 1,416 65 | 1,404 53 | 209 21 | 1,195 32 | 12 12 | 1 1 | 11 11 |
| 2018-19 | 1,511 95 | 1,463 59 | 208 -1 | 1,255 60 | 48 36 | 8 7 | 40 29 |
| 2019-20 | 1,560 49 | 1,500 37 | 201 -7 | 1,299 44 | 60 12 | 8 0 | 52 12 |
| 2020-21 | 1,561 1 | 1,502 2 | 192 -9 | 1,310 11 | 59 -1 | 4 -4 | 55 3 |
| 2021-22 | 1,311 -250 | 1,224 -278 | 136 -56 | 1,088 -222 | 87 28 | 11 7 | 76 21 |
| 2022-23 | 1,261 -50 | 1,120 -104 | 133 -3 | 987 -101 | 141 54 | 23 12 | 118 42 |
| Average | 1,346 | 1,309 | 176 | 1,133 | 37 | 5 | 32 |