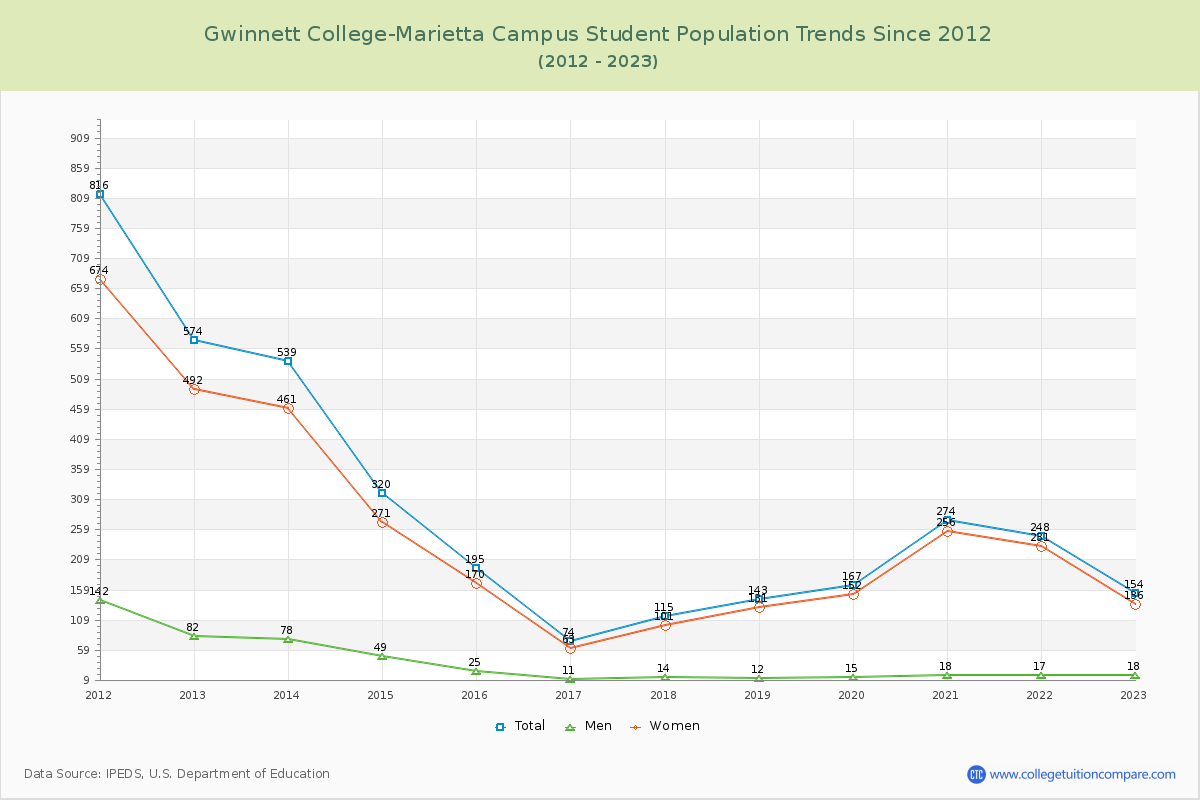
Student Population Changes
The average student population over the last 12 years is 255 where 154 students are attending the school for the academic year 2022-2023.
The female to male ratio is 7.56 to 1 and it means that there are far more female students enrolled in Gwinnett College-Marietta Campus than male students.
The following table and chart illustrate the changes in student population by gender at Gwinnett College-Marietta Campus since 2012.
| Year | Total | Men | Women |
|---|---|---|---|
| 2012-13 | 574 | 82 | 492 |
| 2013-14 | 539 -35 | 78 -4 | 461 -31 |
| 2014-15 | 320 -219 | 49 -29 | 271 -190 |
| 2015-16 | 195 -125 | 25 -24 | 170 -101 |
| 2016-17 | 74 -121 | 11 -14 | 63 -107 |
| 2017-18 | 115 41 | 14 3 | 101 38 |
| 2018-19 | 143 28 | 12 -2 | 131 30 |
| 2019-20 | 167 24 | 15 3 | 152 21 |
| 2020-21 | 274 107 | 18 3 | 256 104 |
| 2021-22 | 248 -26 | 17 -1 | 231 -25 |
| 2022-23 | 154 -94 | 18 1 | 136 -95 |
| Average | 255 | 31 | 224 |